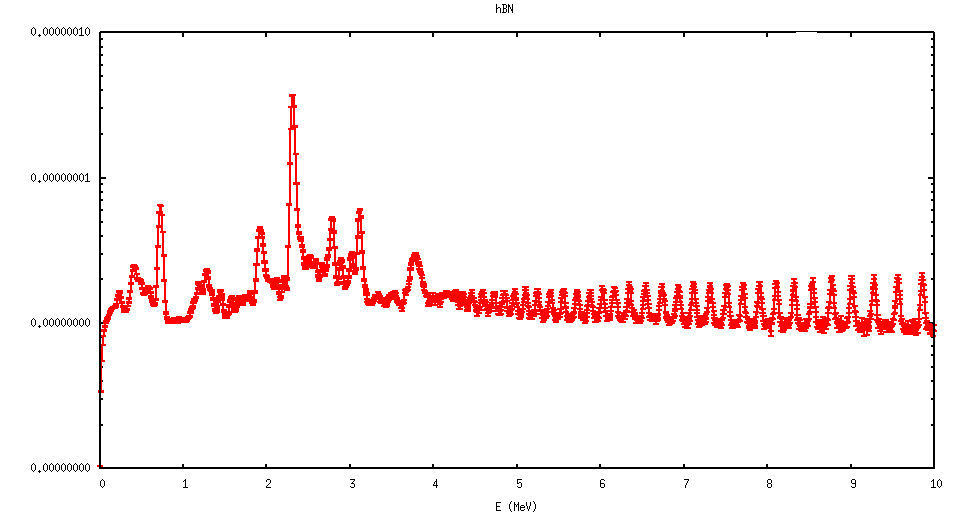
There are lot of peaks appearing alongside the peaks at 1.4 , 1.7, 2.3 and 2.7 MeV. There is a wired oscillation appearing beyond 4MeV. I would like to know whether this extra peaks appearing because of simulation error ?
If it is simulation error, please advice me to solve this.
Hi @nadeeraBUL2020, please also provide a bit more information on what you are showing in the plot? It corresponds to which scoring/detector you applied since you defined several of them? Also what are you trying to achieve with the user routine? Are you incorporating the results of this routine in what you show?
1.Plot is deposition spectra of h-BN when exposed to thermal neutrons.
2. Detector in the target area ( region 1) is used for this spectrum.
3.to get smooth peaks, user routine were applied
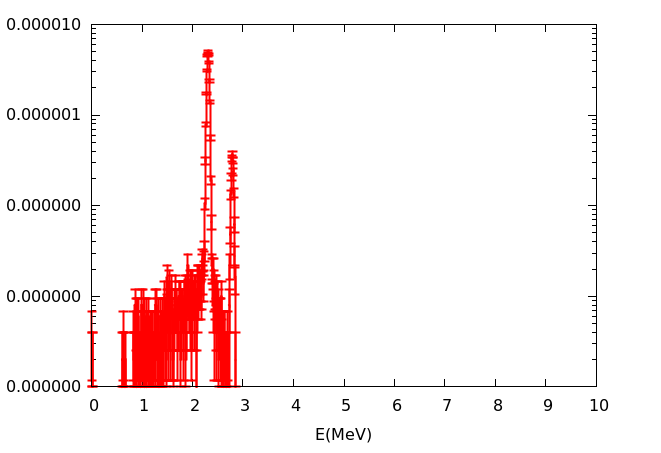
Thanks for providing the extra info. However taking a closer look at your input file your are simulating a source of 25 eV neutrons with a momentum spread of 1.8 GeV/c which seems very unrealistic. The oscillatory pattern could arise from high-momentum neutrons generated due to this large momentum spread and inappropriate energy binning. Perhaps try again first with a more realistic momentum spread and check if the pattern is still there?
Hi Nadeera, so as you can see the strange oscillatory behaviour above 4 MeV has disappeared. As you stated before you are already using a routine which “smooths” the spectrum you obtain from FLUKA, I believe a similar (if not the same) procedure can be used to take into account the actual energy resolution of the detector you are trying to simulate. Of course when comparing this kind of detector response simulation to an experimentally obtained spectrum you need to make sure all relevant physical processes (e.g. for photons) and associated scorings are appropriate, also the detector itself needs to be accurately modeled to be able to make an accurate comparison. In case you would like more details on this looking at a similar problem please have a look at this interesting thread.