Dear Experts
Greetings. I am trying to simulate the gamma spectrum from aluminum alloy that has been irradiated with thermal neutrons and allowed to decay. I do that in 2 steps. In the first step, the sample is irradiated and gamma spectrum after a specific decay time is recorded using USRBDX. In the second step, the output of the USRBDX is used as source for gamma which are incident on a HPGe detector. The HPGe spectrum is recorded using DETECT card. THe fluka files and the source routine for second step are attached source_newgen_NAA-12.f (21.0 KB) NAA_al6061_2ndstep.inp (2.5 KB)
. The output of 1st step is attached. NAA_al6061-12_25_tab.lis (88.0 KB)
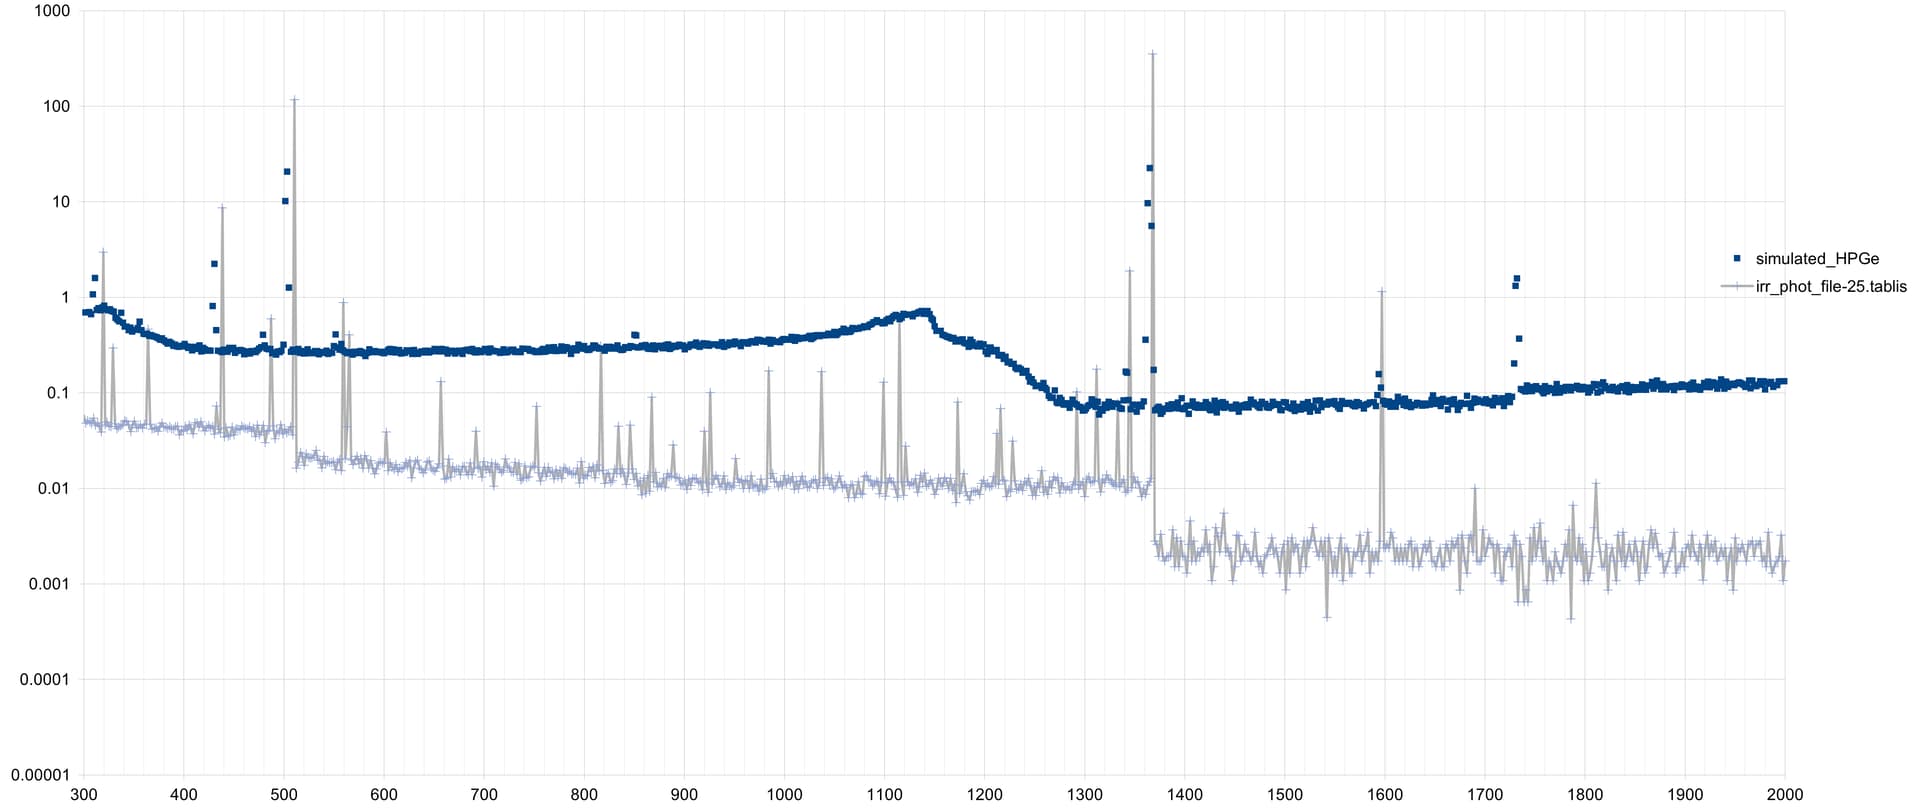
The problem I am having is that while the usrbdx output has whole lot of gamma lines, the DETECT card output has only 5-6 gamma peaks. please see the attached plot.
I tried running the simulations with increased number of primaries but that did not help. can you please suggest what mistake I might be making?
thanks & regards
saurabh
Thank you for your question. After reviewing your files, I do not find any mistake. Most of the peaks are probably not high enough to be resolved by the photon detector. Aside the mean detection peak, a fraction of the photons deposit only a part of their energy, creating a distribution of deposited energies. In your case, the initial distribution of energies is quite wide, and only the most prominent peaks are found in the deposition spectrum. I propose you play with some mono-energetic photon beams and compare the results.
Please let me know if this is helpful.
Best regards,
It looks as if many of the photons with E < 1200 keV are masked by the compton-scattered photons of the 1360 keV peak.
Do you have an experimental HPGe spectrum to compare with ?
Dear Mario
thanks for your reply. i was worried my source_newgen.f is not set properly. so, yes your reply clarifies that. Let me try changing the chemical composition of the material which was irradiated in 1st step.
thanks & regards
saurabh
Dear Thomas
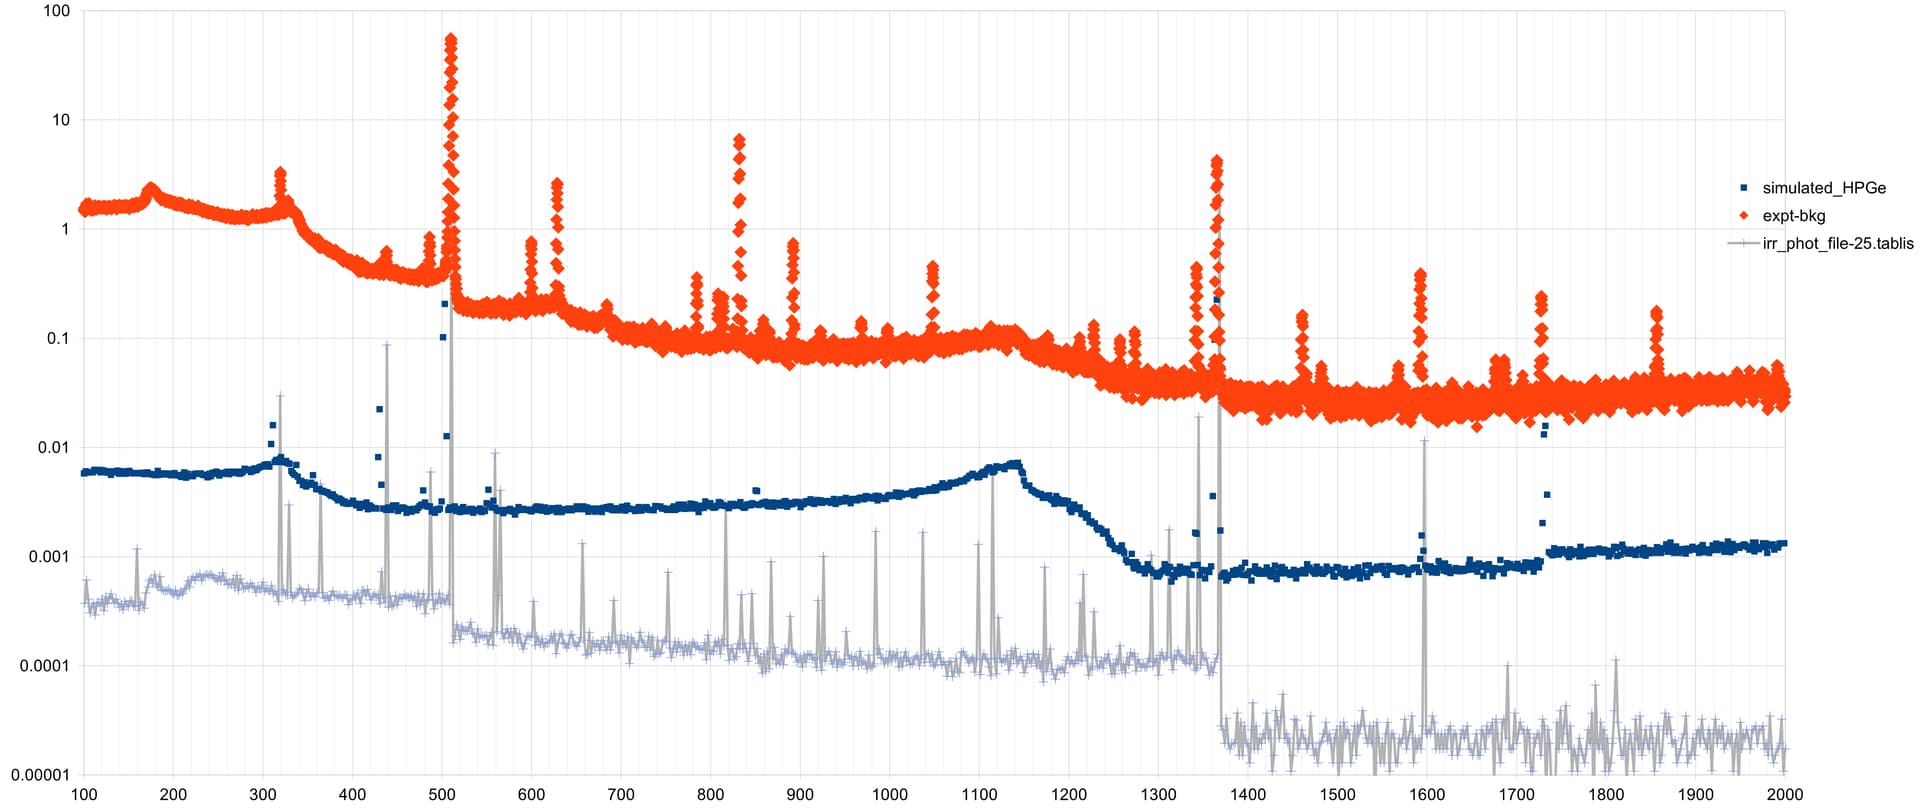
thank you for your reply. Please find attached the experimental spectrum. A very low intensity background spectrum has already been subtracted from it. The Y axis is in counts per sec.
I have shifted the simulated ones slightly down for visibility. The experimental spectrum is attached here as well. al6061_neut_act_HPGe_spect.txt (196.9 KB)
The fluka files for first step are- NAA_al6061.flair (30.1 KB) NAA_al6061.inp (8.5 KB)
Comparing the experimental to the simulated HPGe spectra, it looks as if your simulated detector produces a too high compton scattering background which masks the lower energy gamma lines. In the simulation, the compton edge at 1.1 MeV is one order of magnitude higher than the background from 1.4 MeV on, while the experimental compton edge is relatively lower.
To amend the problem I would try to improve the detector simulation, not the chemical compositioin of the target.
We are having some problem explaining the origin of various gamma peaks. We are planning to repeat this experiment. May this thread be closed. thank you Thomas and Mario for your help.