I am simulating two different scintillation detectors, NaI(Tl) and LiI(Eu), using a Cs-137 (661.7 keV) source. Despite the different material properties and geometry sizes, the energy deposition spectra produced by the DETECT card are exactly the same for both detectors.
Simulation Setup:
Source: Cs-137
Scoring:DETECT card used for energy deposition in the crystal region.
Geometry: The crystal sizes are different, but I have used the same casing, reflector, and window setup (scaled to fit each crystal).
Materials: NaI(Tl) and LiI(Eu) have been defined with their respective densities and compositions.
The Problem:
When I plot the spectrum for each detector, the results are identical. I expected to see differences in the photofraction or peak efficiency due to the different densities and cross-sections of NaI and LiI.
I have attached my .flair and .inp files, and I am also uploading the resulting spectrum for each detector separately for your review.
Could you please help me understand why these two different materials yield identical spectra in FLUKA? And also how to apply energy broadening to these results to obtain a realistic detector spectrum that matches experimental data?
Hello,
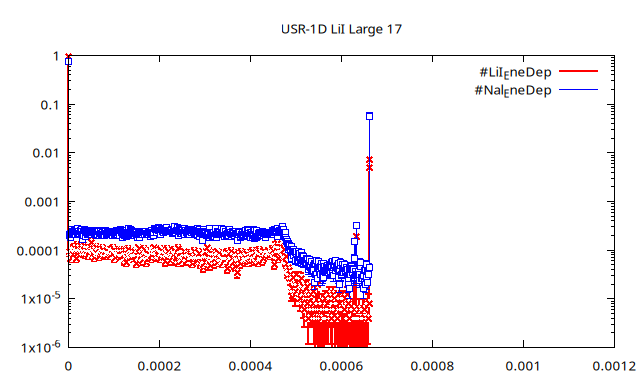
I believe you must have mixed up some output files. I ran your input files, with 10 times less statistics and by setting the Pb shield to BLACKHOLE-material to save runtime. I also corrected the beam energy in LiI from 662 MeV to 662 keV. The two materials have a distinctly different efficiency, as can be seen by the joint plot.
I see that things are more clear now, thanks to @totto. Nevertheless, I wanted to add a few details which may be of use.
Could you please help me understand why these two different materials yield identical spectra in FLUKA?
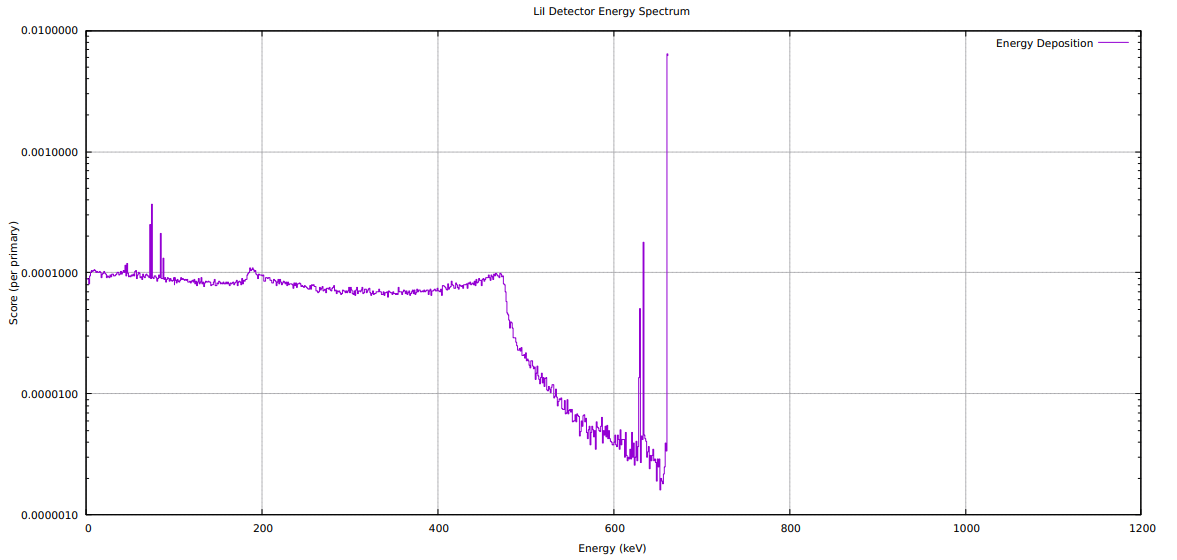
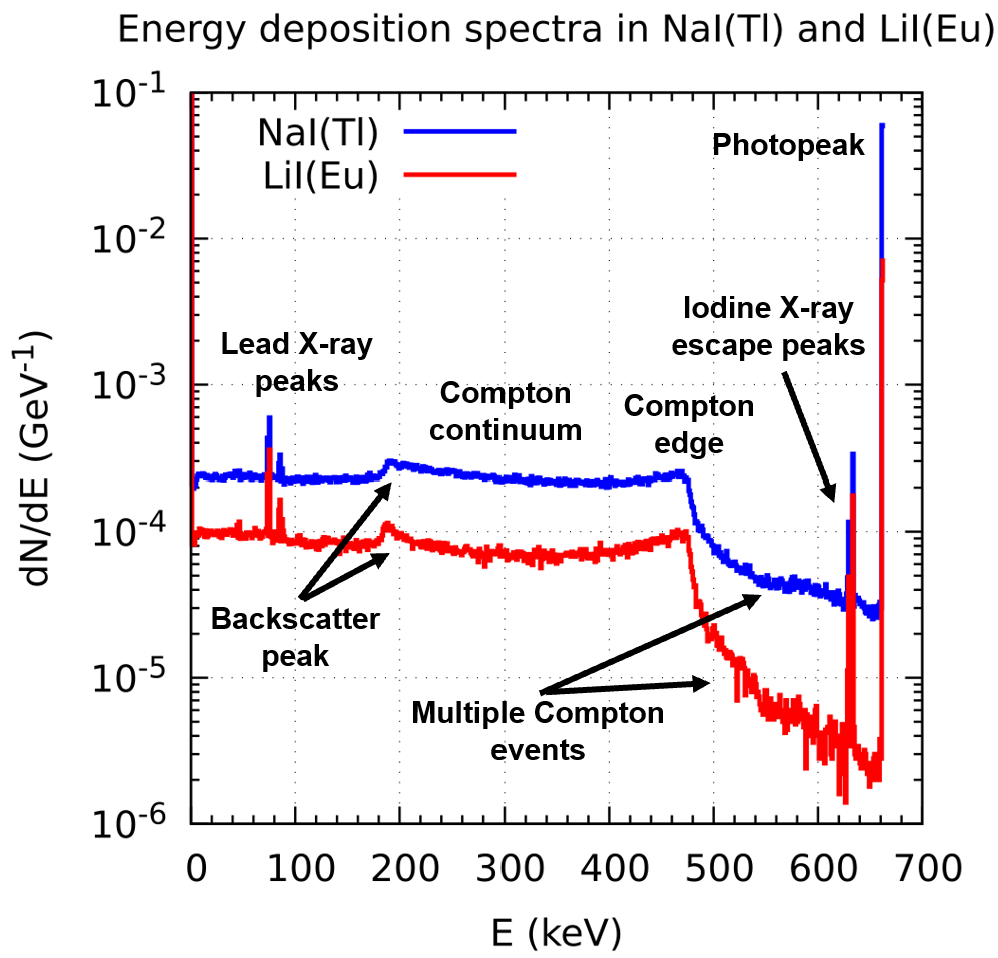
With the MeV to keV correction implemented in the LiI_Large.inp input file, I ran your simulation setups for the two scintillation detectors and I got the following energy spectra:
The two spectra exhibit similar shapes due to the following reasons:
The 662 keV photopeaks are dictated by the Cs-137 source.
The ~477 keV Compton edge is given by kinematics since the maximum energy transfer from a 662 keV photon to an electron in a single Compton interaction is ~477 keV, regardless of material.
Iodine (Z=53) dominates the interaction probabilities for Compton scattering and photoelectric effect in both crystals due to its large atomic number. The photoelectric absorption cross section scales with Z^n, where n = 4 or 5 depending on the gamma-ray energy, while the differential cross section for Compton scattering is proportional to Z (see Radiation Detection and Measurement by Glenn F. Knoll).
Nevertheless, some differences can be observed which are due to the different dimensions of the two crystals:
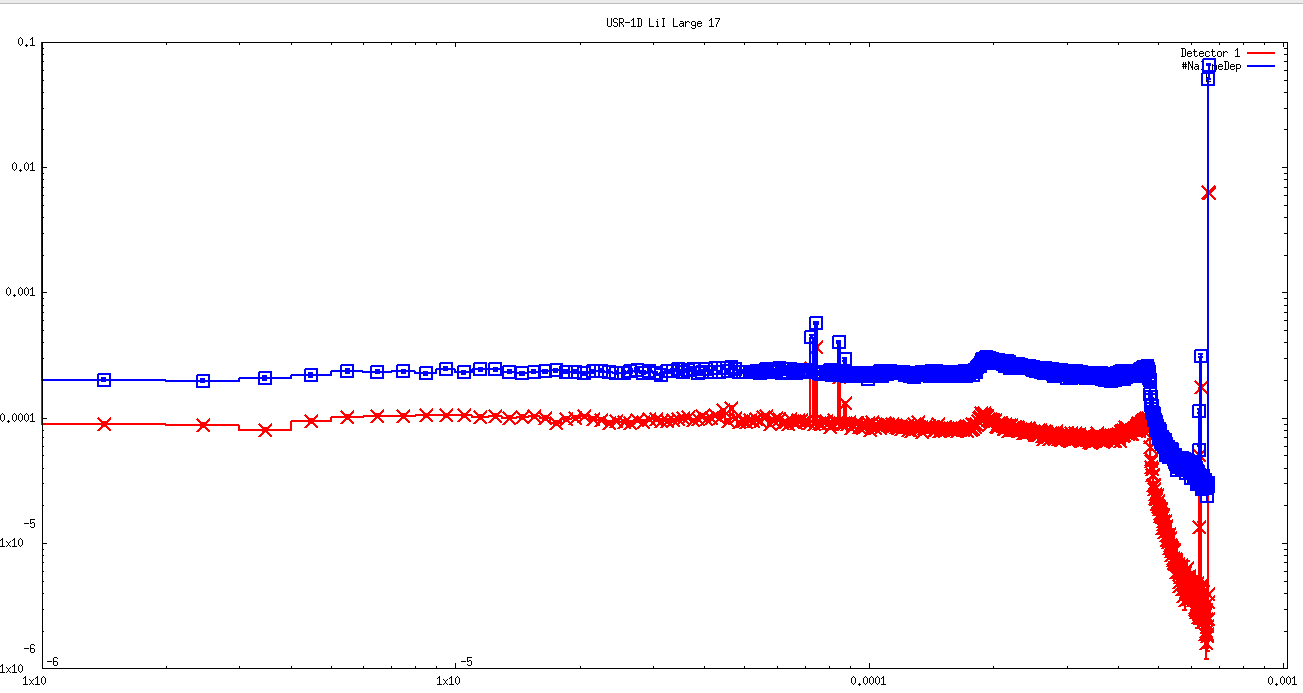
The total yield is higher for NaI(Tl) since it intercepts and stops more photons compared to LiI(Eu), meaning that the two crystals have different efficiencies (as indicated by @totto).
In the large NaI(Tl) crystal, photons may scatter multiple times until they are fully absorbed, depleting the low-energy Compton continuum in favour of the photopeak. This multiple scattering effect can also be seen in the “valley” between the Compton edge and the photopeak: the LiI(Eu) crystal is highly depleted in this region (compared to NaI(Tl)) because photons have a higher probability of escaping before another Compton scattering occurs. If one evaluates the photofractions (excluding the first bin with energies between 0 and 1 keV, which would correspond to photons passing through the crystal without interacting) one gets ~0.5 for NaI(Tl) and ~0.2 for LiI(Eu). Therefore, the two photofractions are indeed different.
The Iodine X-ray escape peaks at ~630-640 keV are higher for LiI(Eu) because the ~30 keV X-rays generated near the surface have a higher probability of escaping its small volume compared to the NaI(Tl) crystal where they can be reabsorbed.
And also how to apply energy broadening to these results to obtain a realistic detector spectrum that matches experimental data?
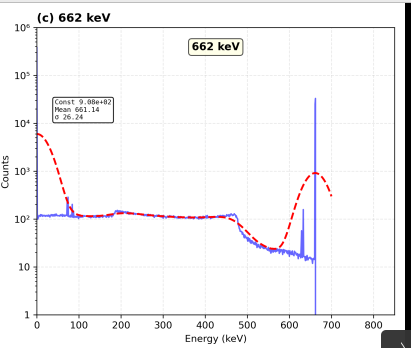
You can apply a Gaussian broadening onto the scored energy deposition spectra with the DETGEB card. For more details, please consult the dedicated documentation in the FLUKA manual.
Thank you very much for the thorough explanation—this is extremely helpful. I agree with your analysis, especially regarding iodine’s dominant role, the multiple scattering effects in NaI(Tl), and the more prominent escape peaks in LiI(Eu).
I’ll proceed with applying energy broadening using the DETGEB card as you suggested
Best regards,
Sana