I would like to implement a SOBP in FLUKA, using the recipe described in Bortfeld and Schlegel Phys. Med. Biol. (1996) 41 1331. In this article, the authors only consider dose deposition due to electromagnetic interactions. Under this hypothesis, they derive an algorithm to calculate the probability of emission as a function of energy, which you should use to implement a SOBP in the simulation.
The problem is that when I use this energy spectrum in the FLUKA simulation, I get a dose distribution that is far from a SOBP. I have used this energy spectrum in other Monte Carlo codes (TOPAS/Geant4 and PENHAN/PENELOPE) and I have obtained a dose curve corresponding to a SOBP (attached figure).
As far as I have used theoretical results to define the energy spectrum used to implement the SOBP in the simulation, I am afraid of doing something wrong in the process that I have used to read the information of this energy spectrum. Could there be a problem with the script used to read the spectrum data?
I have attached the relevant files to the SOBP implementation. I look forward to your response.
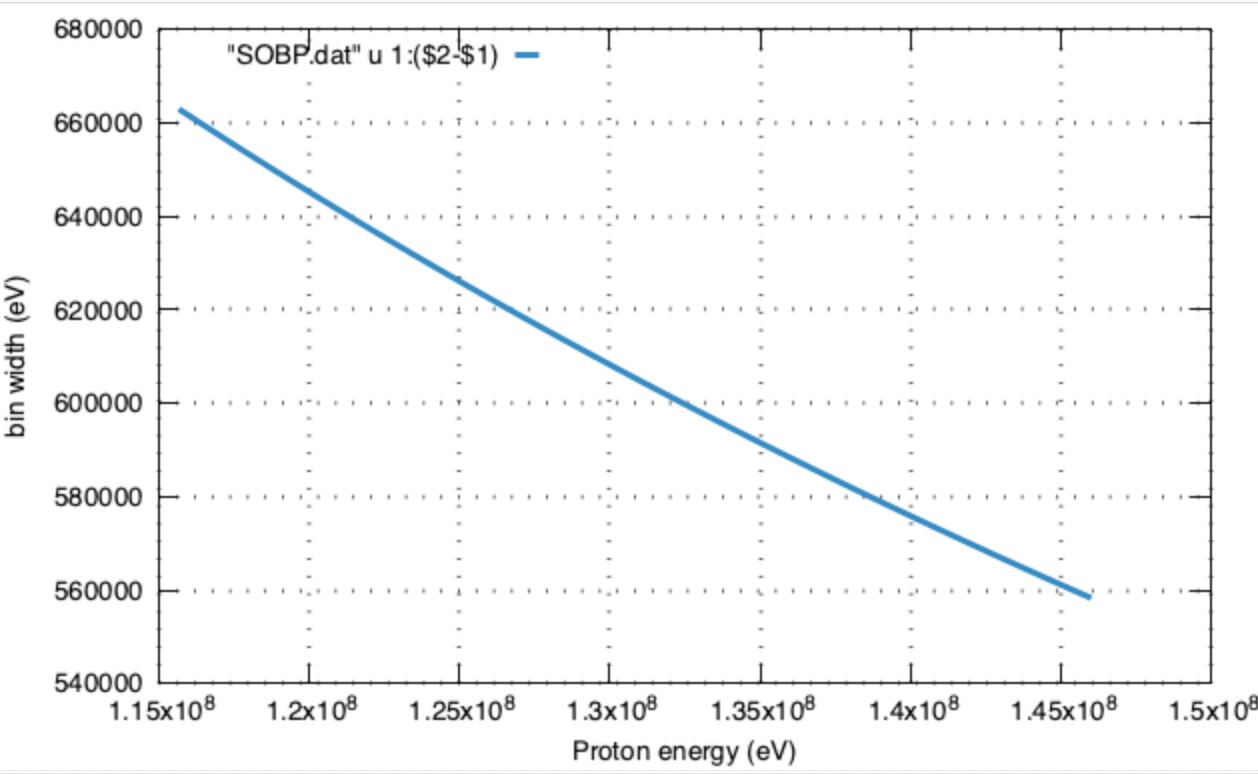
Hypothesis H0: could it be that when you prepared the SOBP.dat histogram you want to sample from you forgot to divide each bin intensity by the corresponding bin width?
For histograms with equispaced bins, this division is irrelevant for the sampling. In your case, however, you have somewhat broader bins for the lower energies, as per this plot straight from your SOBP.dat:
The hypothesized lack of division by the bin width would imply somewhat exaggerating their probability density. That is, if H0 were to hold, you’d be somewhat favoring the shorter ranges, and this might well explain the tilt of your SOBP towards them.
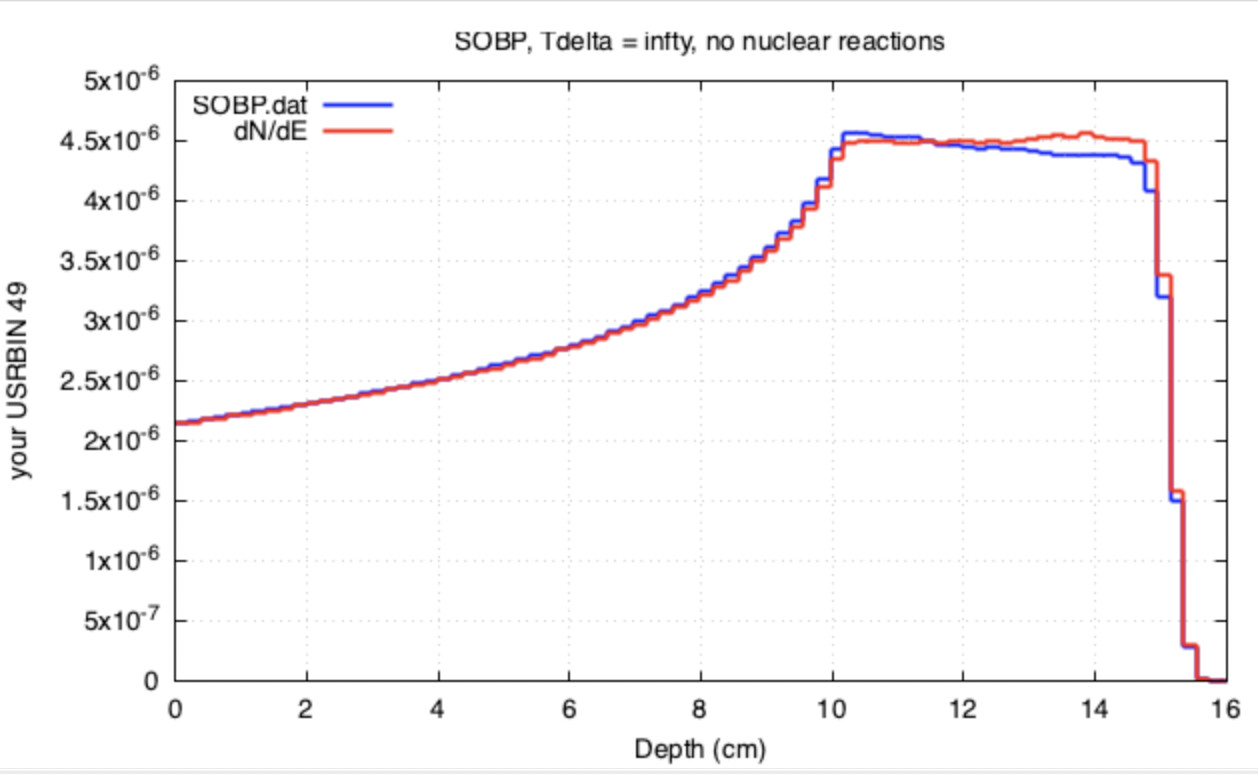
Taking your SOBP.dat and dividing the intensity by the bin width, one goes from your blue curve to the red one, which becomes significantly flatter (for a somewhat short run):
Indeed, the sampling from a histogram in source_newgen.f strictly speaking expects that the histogram is giving a measure of probability density (not a probability) per bin: when building up the cumulative probability distribution it properly multiplies by the bin width. In case of equispaced bins one can merrily commit formal sacrilege and ignore this fundamental detail, but not for histograms with non-equispaced bins.
You may convince yourself by sampling directly from the Bortfeld and Schlegel prescription with a dedicated source routine.
Cheers,
Cesc
PS: kudos to @alserban for preliminary assessments offline.
PS2: i understand your input is a result of many trials, but it needs thorough cleaning up.
You were right. When I implemented the SOBP in the histogram, I didn’t divide by the bin width. I ran a simulation using your instructions and everything is fine.