I am simulating a pencil proton beam passing through various media before hitting a water phantom. The initial energy of the protons is 18 MeV and I am interested in the energy values along the beam propagation axis, especially right before hitting the phantom.
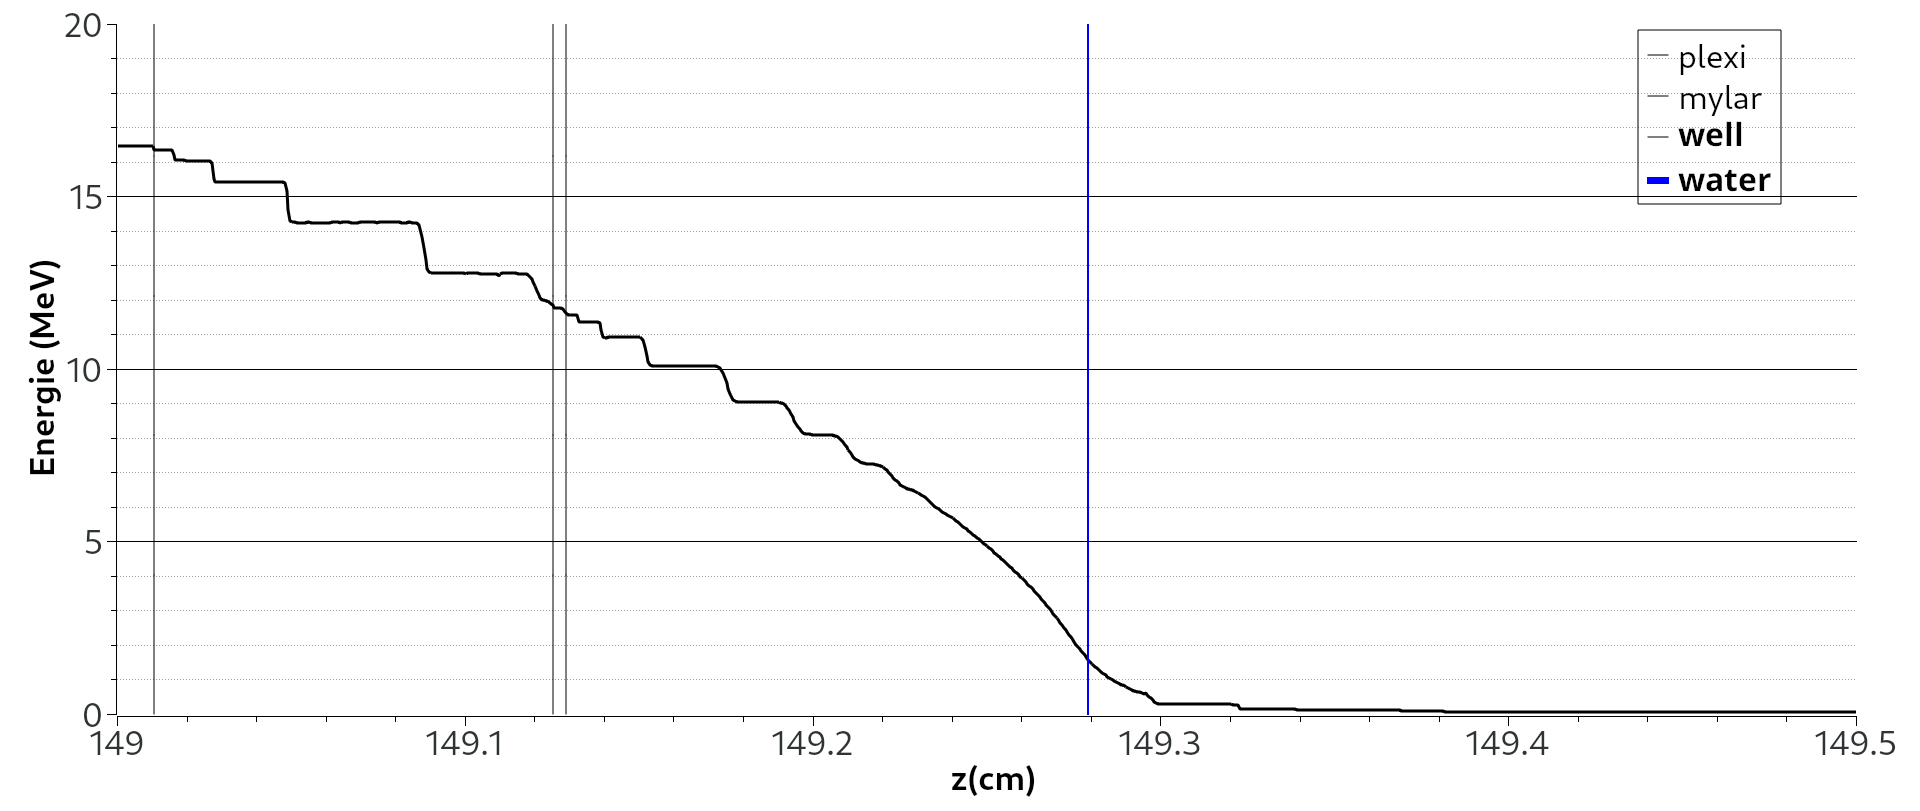
I have computed energy using the method suggested in this post, as it has provided satisfactory results for LET. The obtained graph is shown below. As observed, Fluka predicts a mean proton energy of 1.6 MeV at the water boundary.
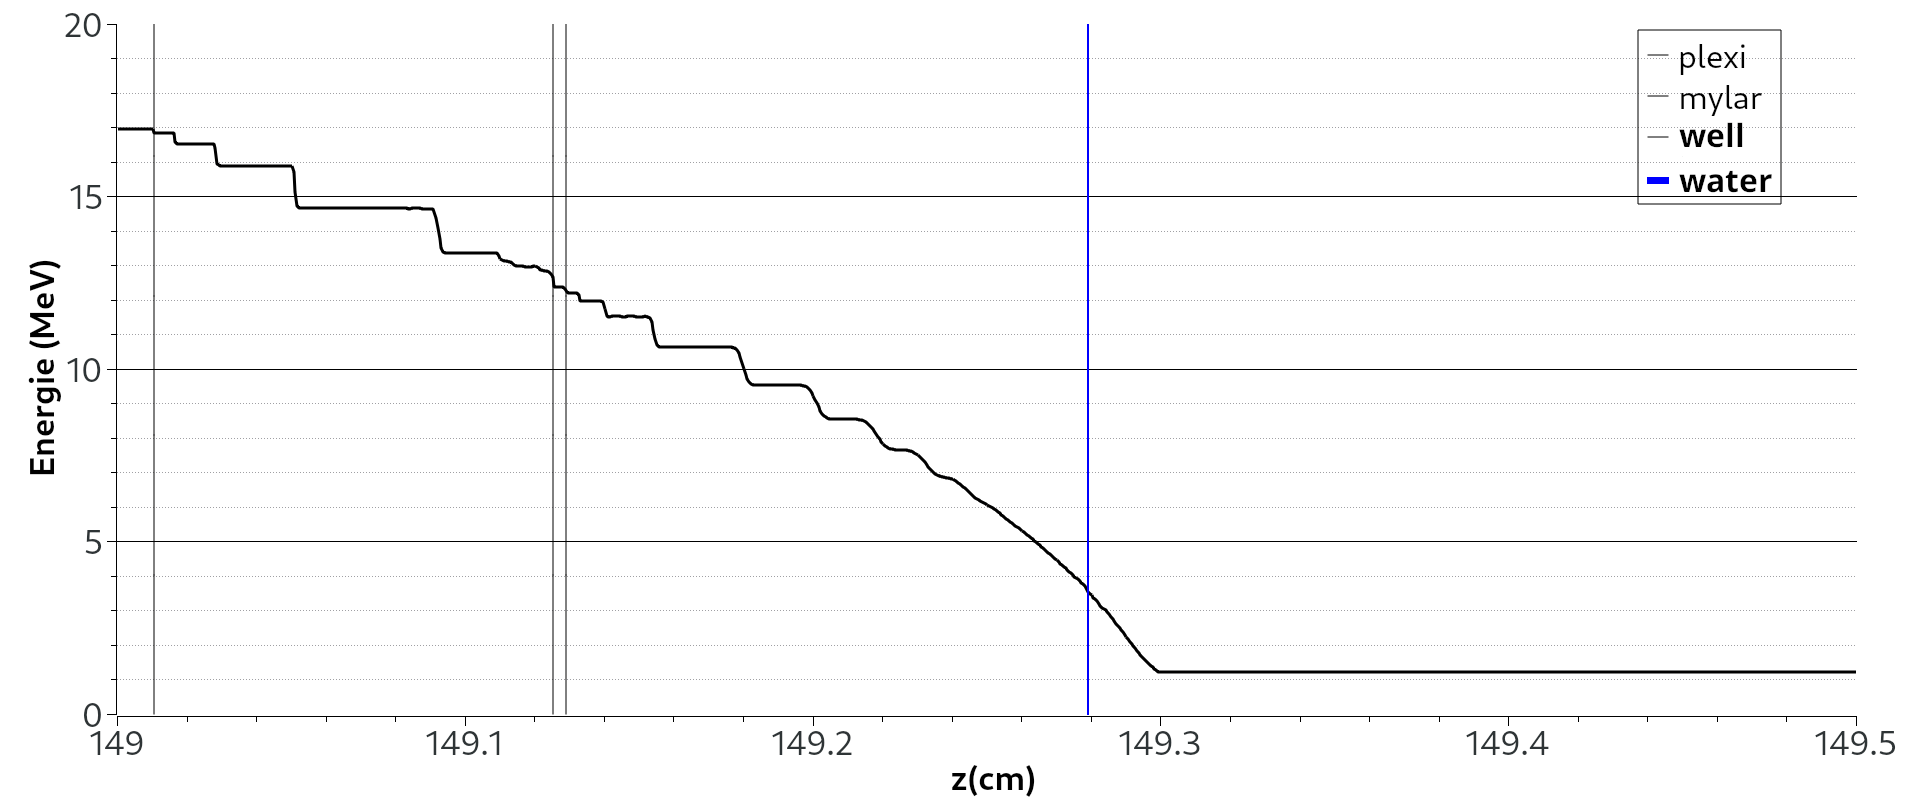
I have also got results from SRIM and LISE++, which are both in agreement but show an energy of around 3.5 MeV at the water boundary. These values clearly do not match the Fluka simulation. The only way I was able to reproduce these results in Fluka, was by removing two 40μm aluminum flanges from the beam path. I have done so by setting their material to vacuum. The graph in this situation is shown below.
Could you help me identify the cause of this discrepancy? Is there something fundamentally flawed with my approach? Or is there any setting that I am missing a card for? (I have looked into modifying the multiple scattering threshold and delta ray production, but have failed to find a solution. Defaults remained set to PRECISIO in all simulations)
Thank you for your message. In order to reproduce your example, could you upload the input files of both graphs? I assume the one you have already uploaded is related to the first graph. Besides, please mind that you refer to two aluminum flanges, while in the input find there is an aluminum one and a tungsten one.
Dear @msacrist ,
Thank you very much for your quick response. I apologise for my poor explanation regarding the flanges. The Al flanges are part of the ‘tube’ region, each of them being placed at one end of the tube. There is indeed a separate tungsten flange which I have not changed during any of the runs.
The input I have uploaded is indeed related to the first graph. The modification I did in order to obtain the second graph was assigning material VACUUM to region tube. I have now also attached an input file that reflects this.
To verify the scoring and user routine, I propose measuring the beam energy between well and water with USRBDX, which should yield the same result:
It provides the fluence crossing that surface as a function of the energy. With some post-processing we obtain the tracklength-weighted energy average (as discussed in the post you mention). My results are identical to yours using the same input files: 1.59 MeV for the case with aluminum flanges and 3.57 MeV without them. Hence, the scoring method seems consistent.
Before studying the impact of other cards, I propose checking that the simulations are comparable, which can be tricky. Have you verified the following?
Geometries are identical
Material properties are similar: densities, atomic composition
Comparable primary beam properties: beam divergence and size
Apologies for the late response. I have indeed done the verifications, as well as produced some new results.
Geometry and materials are identically defined in both Fluka simulations, as well as in SRIM and LISE++. Beam divergence and size should also be comparable.
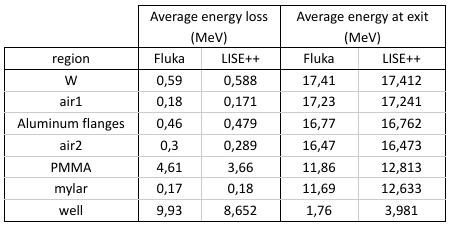
Taking all these factors into consideration, I have configured USRBDX detectors for every interface between consecutive regions and calculated the average energy loss in each region. I compared the results with those obtained from SRIM/LISE++. Minor differences are apparent for each region, but significant disparities are evident in PMMA. It is noticeable that the energy loss in PMMA predicted by Fluka is 1 MeV higher than that predicted by SRIM, despite nearly identical energy at entry. My assumption is that this disparity also contributes to differences in the subsequent media, ultimately resulting in a significant discrepancy in the predicted energy at the well-water interface.
I have recently also read this post and was pondering whether I may also find myself in a gray region in regard to the physical models employed by Fluka. I wonder if this particular problem may also be caused by problematic handling of these intermediate energy protons interacting with light nuclei.
Thank you for the detailed analysis, which is quite enlightening. What you mention about a potential deviation in the proton reaction cross-section could be happening here given the 18 MeV protons. However, the discrepancy you find seems to come from the stopping of the protons, where the proton reactions do not play a dominant role.
Thanks to your analysis, I see that the mismatch starts at the PMMA layer. Could you please check whether the material densities you use are identical in FLUKA and SRIM? There are several definitions in the material dictionaries of both tools. In FLUKA you use the default PMMA whose density is 1.19 g/cm3 (5.2. Pre-defined materials — FLUKA Manual). After having a look at SRIM material list, I find different PMMA definitions, one of which has 0.95 g/cm3 density.
Using the lighter PMMA definition, also available in FLUKA, in the initial input file, the average kinetic energy of protons between PMMA and mylar is 12.85 MeV (good match), and 4.52 MeV between well and water (still some difference).