I am currently trying to reproduce the results from the paper “Distributions of secondary particles in proton and carbon-ion therapy: a comparison between GATE/Geant4 and FLUKA Monte Carlo codes”https://iopscience.iop.org/article/10.1088/0031-9155/58/9/2879 using FLUKA.
In the paper, a 10×10×60 cm³ PMMA target was constructed, and the energy spectrum of high-energy γ rays, along with their production locations, were recorded. The paper specified the following settings for the simulation:
• Energy threshold greater than 1 MeV
• Time threshold less than 10 ns
For my reproduction, I followed the same approach and used the mgdraw.f file to record the emission positions, energies, and age of the γ rays through ID=7. The age was obtained using the ATRACK command, and I also maintained the same thresholds. However, my calculated results are slightly higher than those presented in the paper. I understand that the paper was published in 2013, and since then, FLUKA may have updated its database, which could explain the differences in my results.
Prompt Gamma Distinction :
I have set ID=7, with a time window of 10 ns and energy greater than 1 MeV. Is this setup sufficient to distinguish prompt γ rays from other γ rays? Or is there a more specific setup required to accurately separate prompt γ rays?
Understanding of “Prompt Gamma Rate per Primary” :
• I would like to clarify my understanding of the “prompt gamma rate per primary (mm⁻¹)” in the context of the location of production of prompt gammas exiting from the target.
• For the vertical axis labeled “rate”, I have interpreted it as a differential, calculated using the formula:
dN/dx = histogram count / (bin width*total number of particles)
Is this data processing approach correct?
I have uploaded my inp file, f file, reference literature, and the reproduction results. I would greatly appreciate it if the experts could kindly review my setup and provide feedback on the accuracy of my reproduction, whether my prompt gamma setup is sufficient, and if my understanding of the prompt gamma rate calculation is correct. carbon.inp (1.5 KB) energy distributions.pdf (12.0 KB) gammaposi_99_and_dose.pdf (20.1 KB) mgdraw.f (14.3 KB) time_spectrum.pdf (34.8 KB)
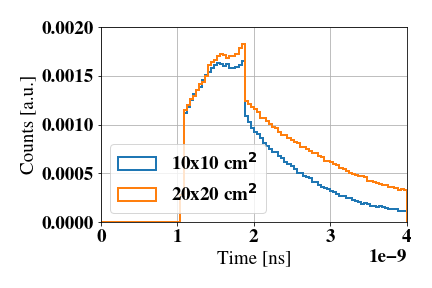
Thank you for your question. Comparing your results in “time_spectrum.pdf” and those in the paper, I notice the main difference lies at times t > 1.8 ns, which must belong to secondary fragments undergoing further interactions. The time of flight of the primaries in the material goes from 1.1 to 1.8 ns.
When focusing on the geometries, I realise that your target is two times wider and longer, keeping the same thickness. Please note the definition of RPP bodies.
Indeed, this makes that the deflected particles undergo additional collisions, increasing the counts for times > 1.8 ns, as you can see in the plot below.
Your approach to identify “prompt” photons is valid as long as it matches your definition and purposes. In FLUKA all photons are treated similarly (labelled as PROMPT), with the exception of the photons associated to radioactive decays (labelled as DELAYED). These are not propagated unless you enable the RADDECAY card.
“Prompt gamma rate per primary [1/mm]” can be seen as the inverse of the mean distance between two collisions yielding photons, as a function of the depth in the material.
Your interpretation of the differential distributions seems good to me.
Based on your suggestion, I added the RADDECAY card and performed the statistics for positrons and annihilation photons. I used USRBIN with the POSITRON PART and ANNIHRST PART scorings for this purpose. At the same time, I also recorded the positions of positrons and annihilation photons using mgdraw.f, with the conditions:
• KPART(KP) .EQ. 7 .AND. (ICODE .EQ. 214 .OR. ICODE .EQ. 215) for positrons
• KPART(KP) .EQ. 4 for annihilation photons
I would like to understand the difference between these two recording methods, and which one is more accurate or recommended in this context.
The thresholds proposed for the electron/positron/photon should be low enough for your purposes. Actually, they are the lowest possibles values in FLUKA for e-/p+. I propose you set the FUDGEM parameter to 0, as suggested in the manual for such low thresholds.
Concerning the two methods you compare, I understand you refer to USRBIN and mgdraw.f. By setting the proper binning, results from mgdraw ICODE 215 and USRBIN ANNIHRST should yield comparable results. However, POSITRON in USRBIN yields the track-length density fluence which is different to the rest of variables we have discussed about.