Dear FLUKA experts,
When I use RADDECAY and DCYSCORE cards to calculate the delayed dose-eq, I can obtain the total dose rate of all residual, but is there a way to know which residual is the main contributor to the dose rate?
This is an interesting question, so I look forward to what the experts have to say.
For now, I can share what I know on the topic, which is that my approach is to pair a residual dosemap with a RESNUCLEi card (and DCYSCORE card, without it the output of RESNUCLEi is total nuclides produced instead of activity in Bq). This will tell you which isotopes have the largest activity.
As for which contributes the MOST to the dose equivalent… there is quite a variety of factors that make certain isotopes more harmful to human health than others, and given the thousands of isotopes that might show up in a RESNUCLEi card, it helps to either be on the lookout for especially bad-actors (e.g., Co-60) OR to have a table of effective conversion coefficients handy, or built into an automated program.
You may find this particular paper helpful: HP200651 271…291. It also cites results from Oak Ridge National Laboratory.
What you’ll find is that dose values from this method are… a rule of thumb at best, and should be treated as approximate. A built in assumption is that all of your radionuclides are concentrated to a point, or at least can be approximated that way if you are standing far away (so, in the far-field regime as it were). Moreover, these tables are not always complete, and I’ve found that the ones that are missing tend to be the short-lived spallation products.
My approach was to write a script that takes the activity of each nuclide from the output file and references one of those conversion coefficient databases to estimate the gamma dose from each, and can then sort by highest to lowest. I have one that works for a different radiation transport program (MARS & DeTra), and am working on adapting it to FLUKA as well. But, other work has kept me busy, of course…
In any case: maybe this is helpful. If the experts know of more advanced functionality that accomplishes the same thing, that would be awesome and could save me some time too.
Thank you for your reply. You provided me with a way to estimate dose rates, which was helpful to me.
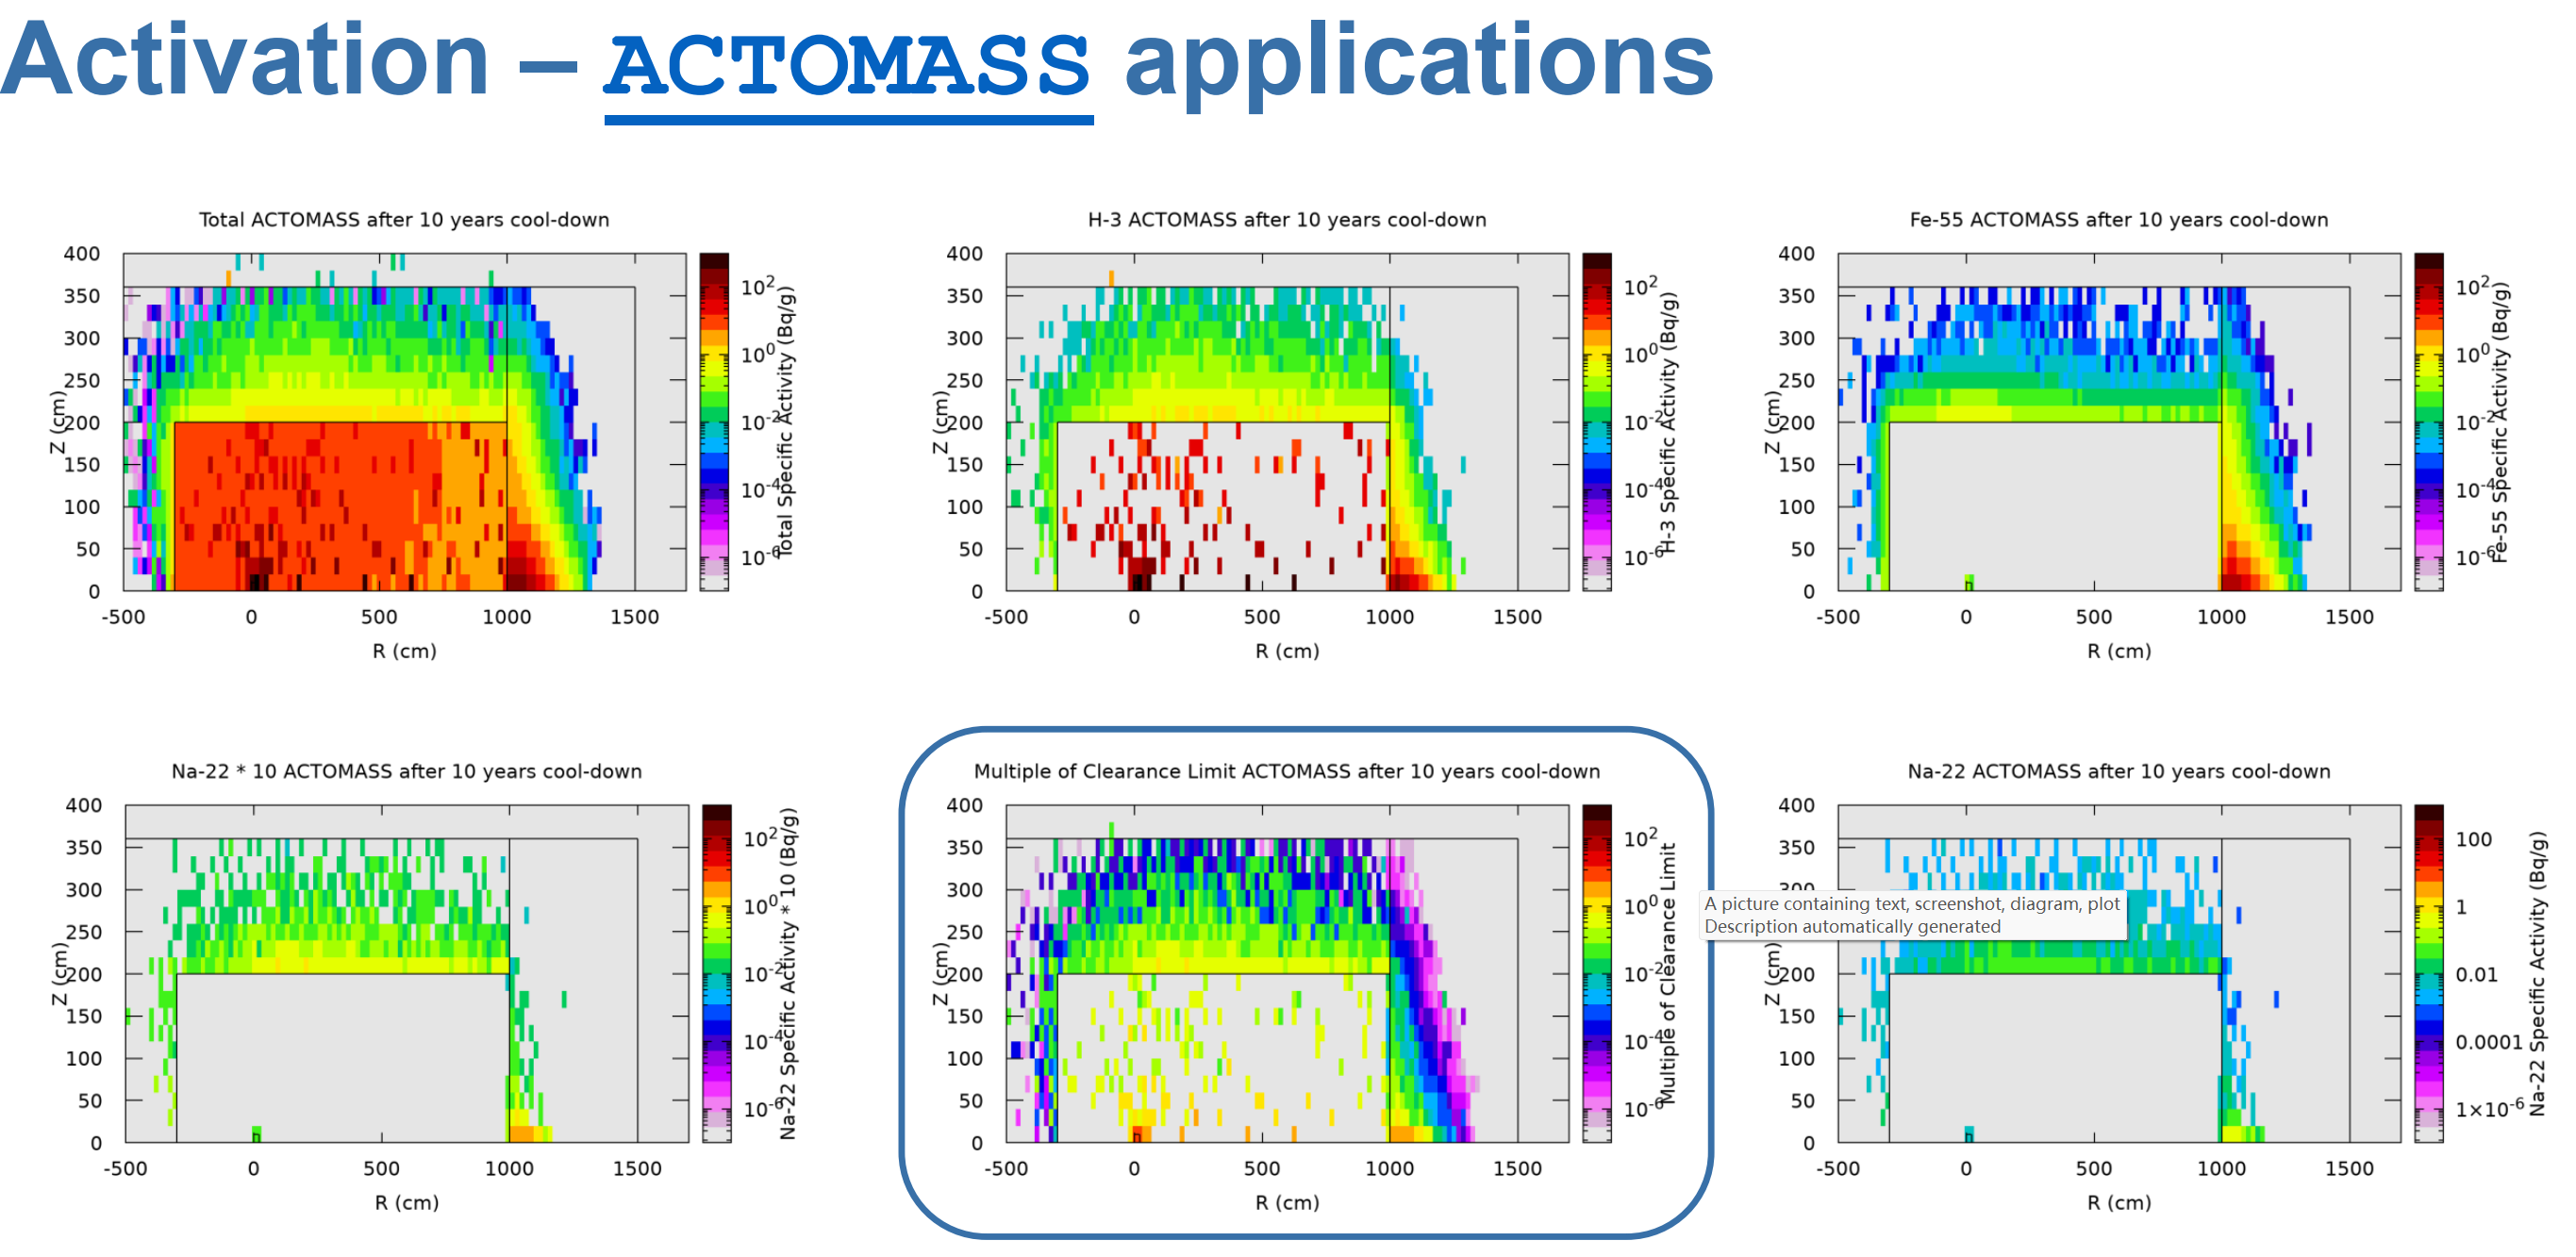
However, if you want to calculate a more complex model, it is still difficult to handle. For example, in a room, the walls or multiple items may produce residual dose rates, and these items may also have multiple nuclide compositions. In this case, if I want to output the residual dose rate distribution map of Na-24 (or other nuclides) in this space to analyze or highlight the dose contribution of a certain nuclide, it seems difficult to achieve directly. The desired effect is similar to the image of ACTOMASS in the lecture (only in appearance, as I know this image only stays at the previous step of dose rate calculation).
For regions with a single nuclide composition, I can analyze the dose rate contribution of each region one by one by setting the MAT (Decay) cards of other regions to vacuum, in order to analyze the dose rate contribution of nuclides. However, for nuclides with complex material compositions, I currently have no idea.
Looking forward to the expert’s response.
You can filter the DOSE-EQ USRBIN scoring as a function of the parent radioactive isotope, whose identity (in the form A + 1000 Z (+ 1000000 m)) is stored by the IAZTRK variable in trackr.inc.
This means that you can clone the aforementioned USRBIN and associate each copy with a different contributor. Such an association has to be made in the fluscw.f user routine (requiring the addition of the USERWEIG card), by including trackr.inc and setting LSCZER to .TRUE. if JSCRNG - i.e., the index of the USRBIN copy - has a given value and IAZTRK does not correspond to the respective nuclide.
I did not test the above, so we’ll be happy to follow up in case of issues.