Dear FLUKA experts,
I wanted to ask about potential reasons for a large disparity in low-energy neutrons, particularly within iron bodies, when using different versions of FLUKA for simulations.
I re-ran an old input file including scorings from 2016 using the new versions FLUKA 4-4-0 and previously FLUKA 4-3-4, and compared the results to those from 2016 in order to look for discrepancies. While many of the results seem somewhat consistent, I spotted a large difference when looking at low-energy neutron fluence and 1 MeV neutron fluence equivalent in particular.
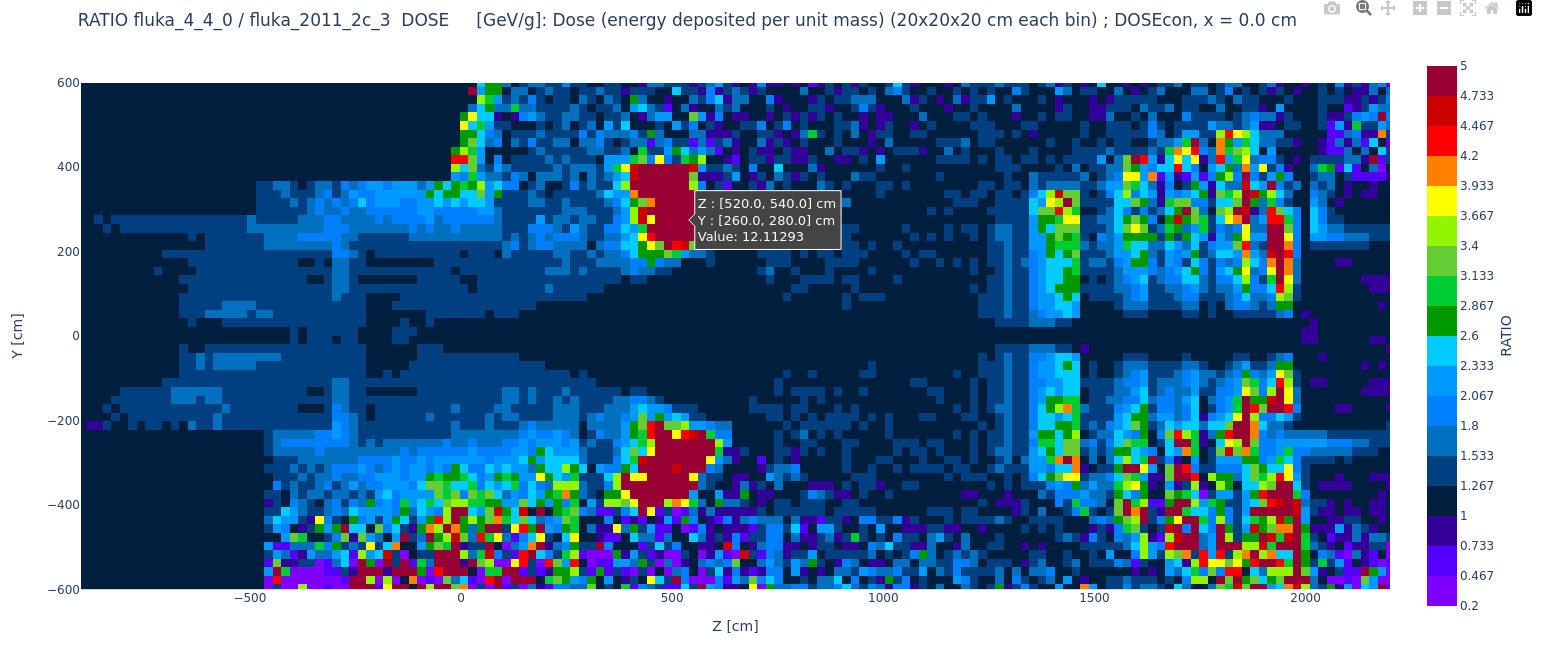
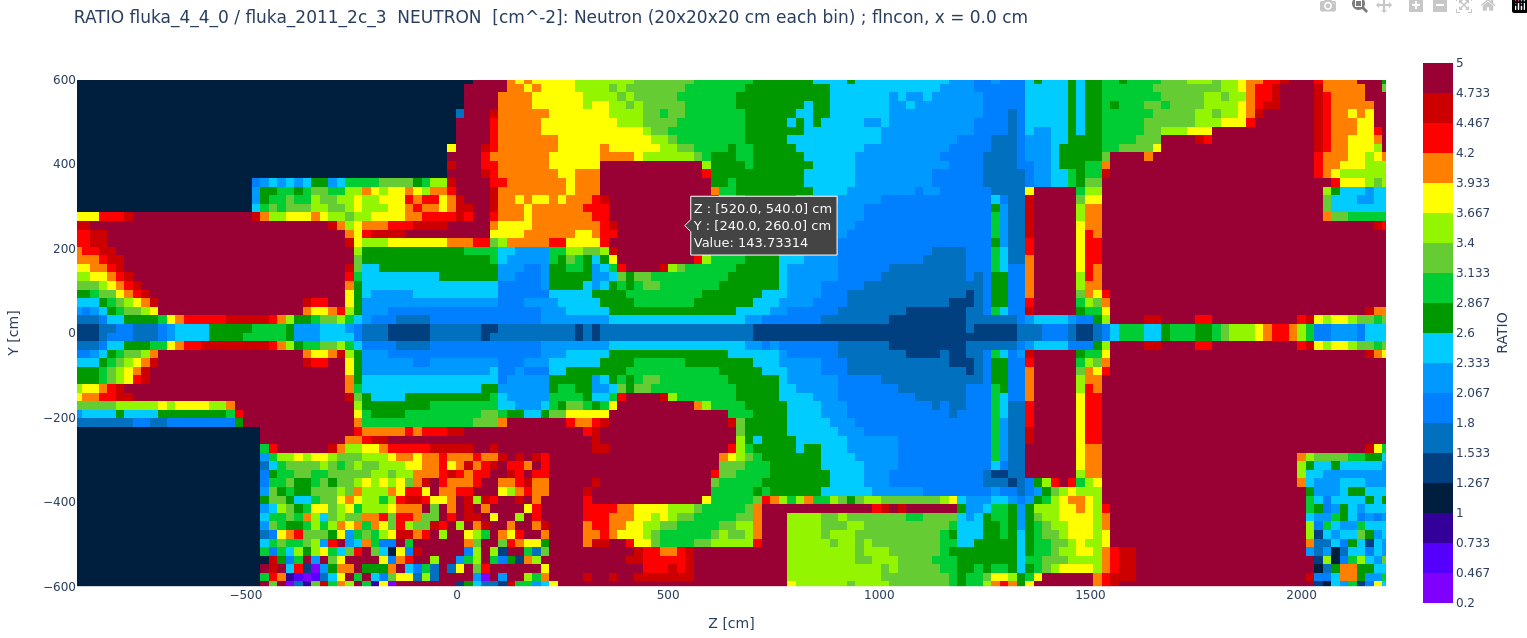
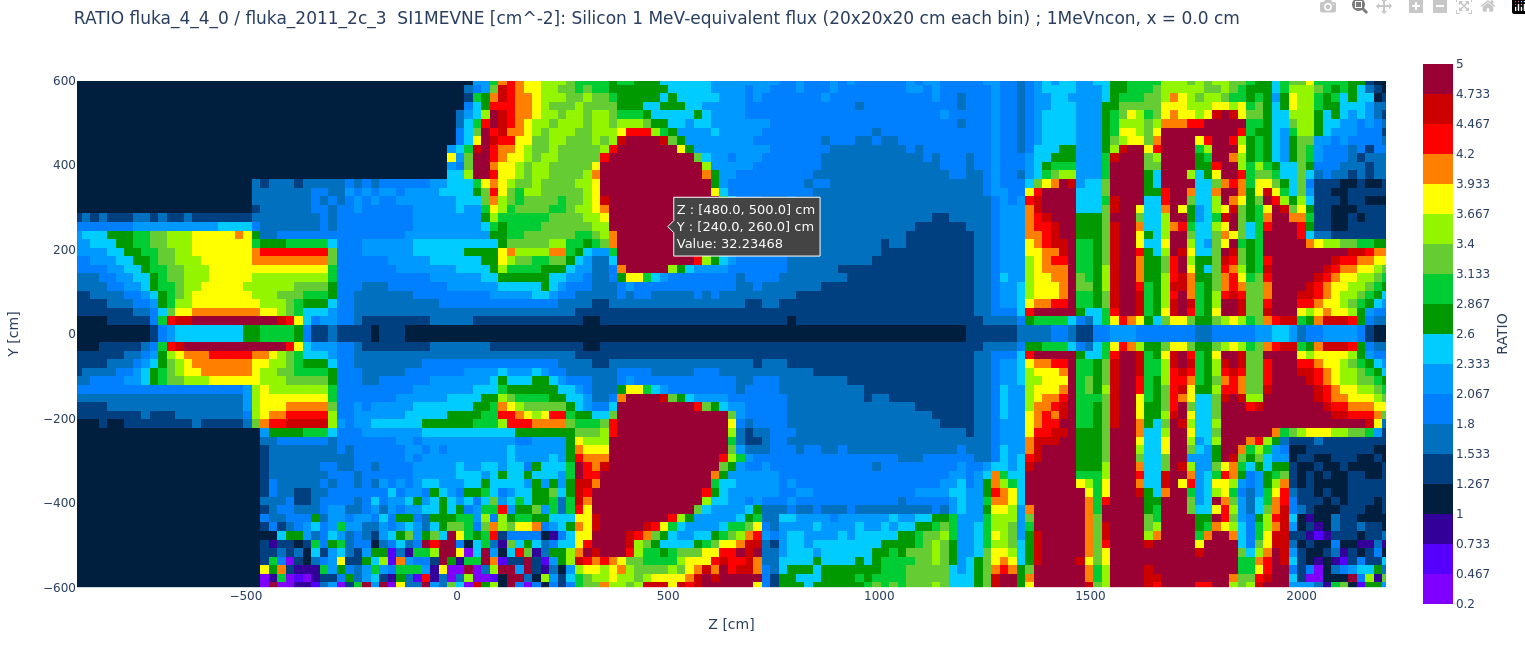
Below are the corresponding ratio plots (values of first map divided by values of second map) between different versions of FLUKA for USRBIN SI1MEVNE, NEUTRON, and DOSE. Prominent features (in red) in the neutron and 1 MeV equivalent fluence maps for z = 500 cm (dipole yoke) and z between 1500 and 2000 cm (muon shielding blocks) are located inside and around massive iron bodies. In these regions, SI1MEVNE and neutron fluence can be several tens of times larger than in the old simulation from 2016.
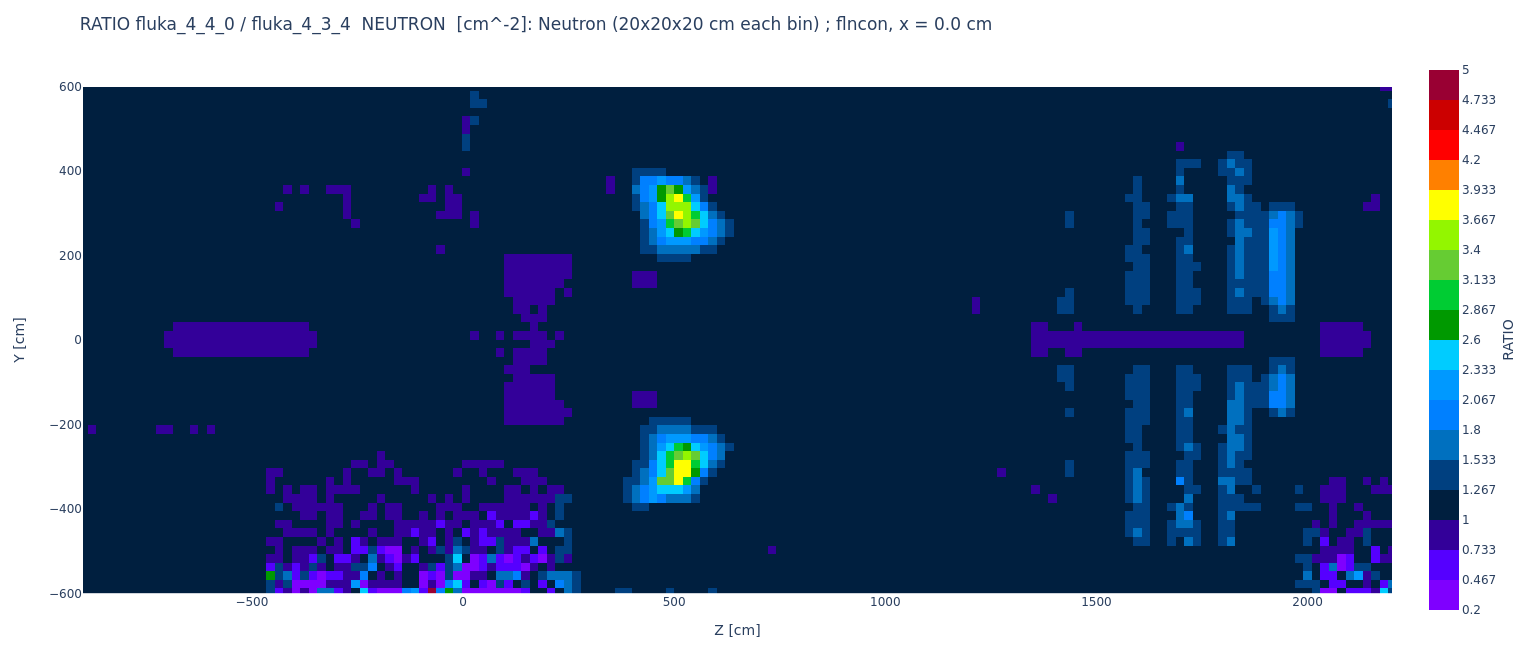
I created similar plots for the latest and previous versions (FLUKA 4-4-0/FLUKA 4-3-4), after installing mandatory and optional neutron libraries, in view of the move from group-wise to point-wise low-energy neutron treatment. In those figures, it can be observed that the recent update has again caused an increase of the neutron fluence in iron elements only.
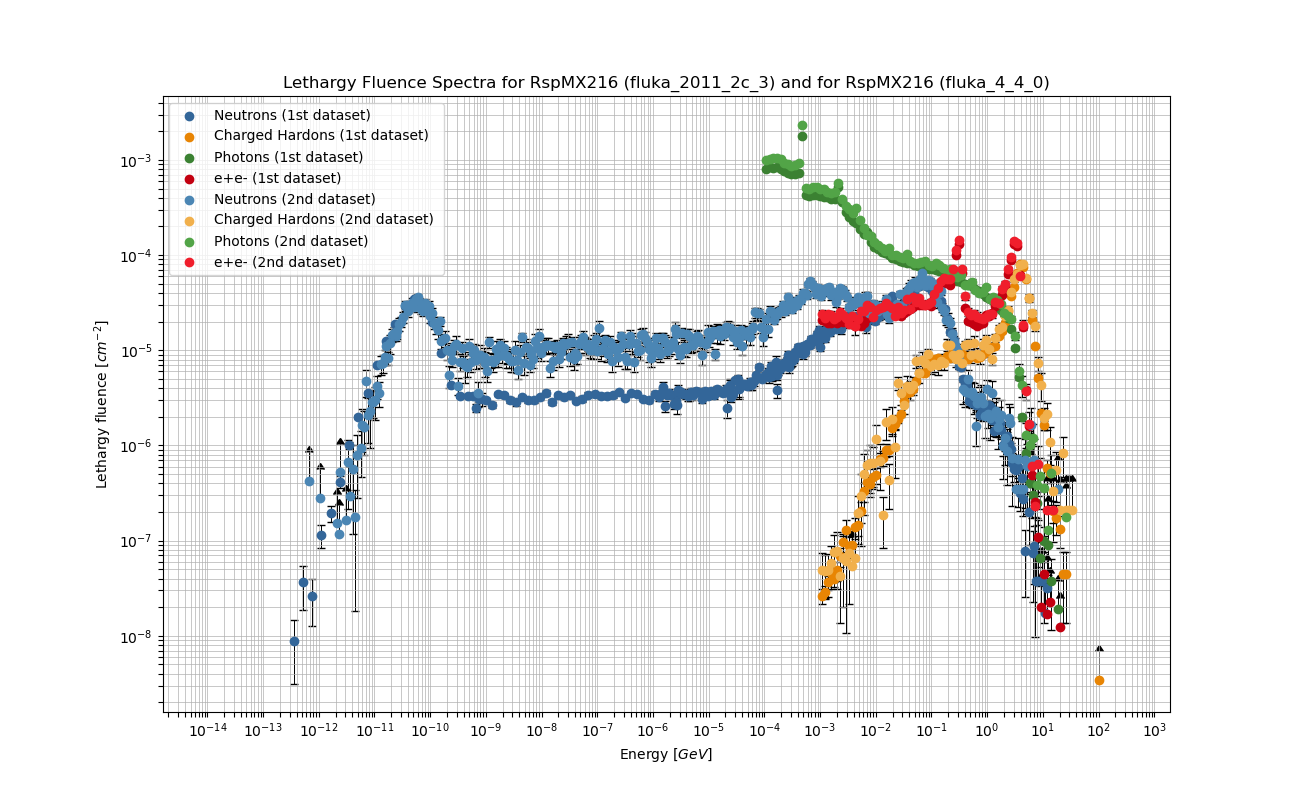
In order to give a bit more context, the last plot shows USRTRACK lethargy fluence spectra for an air region upstream of the calorimeters at the edge of a polyethylene neutron shielding, about 2m from the beam pipe. The neutron shielding was intended to shield sensitive upstream detector elements from 1 MeV neutrons. The USRTRACK is in a position where neutron backsplash from the Electromagnetic calorimeter should be observed, but no significant influence from the neutron shielding is expected. The USRTRACK shows that in the neutron energy range between thermalized and around 10 MeV, the difference in low-energy neutrons is almost one order of magnitude. In the SI1MEVNE plot, this USRTRACK would be located within the region of factor 1.5-2, and in the neutron fluence comparison, it would be in the region of factor 2-3.
Would anyone have any insight on what could be the cause of such large changes?