Please, help me to gain confidence on how I should limit the range over which I average the dose rate in 2D projection. Suppose I project the heatmap in X-Y plane as I did in the flair file attached. How should the limits be chosen such that my results are reproducible by other people? I need to understand this concept for the general case of arbitrary geometry and not necessarily the one I used.
I think I understand how the results are plotted in 2D and 1D projection from the presentation. I was doing that in my simulations.
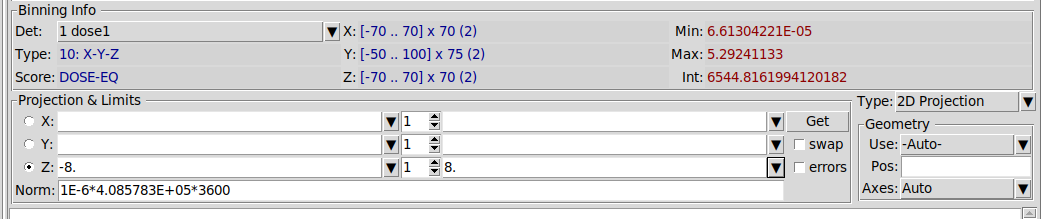
I am sorry to border you. I was thinking about the limits I choose, over which I average the quantity that I score. I thought of this in the sense that if I set the Z range as I did in the picture attached, somebody else may have a different choice. So, how do I build confidence that I am neither underestimating nor overestimating the results I get?