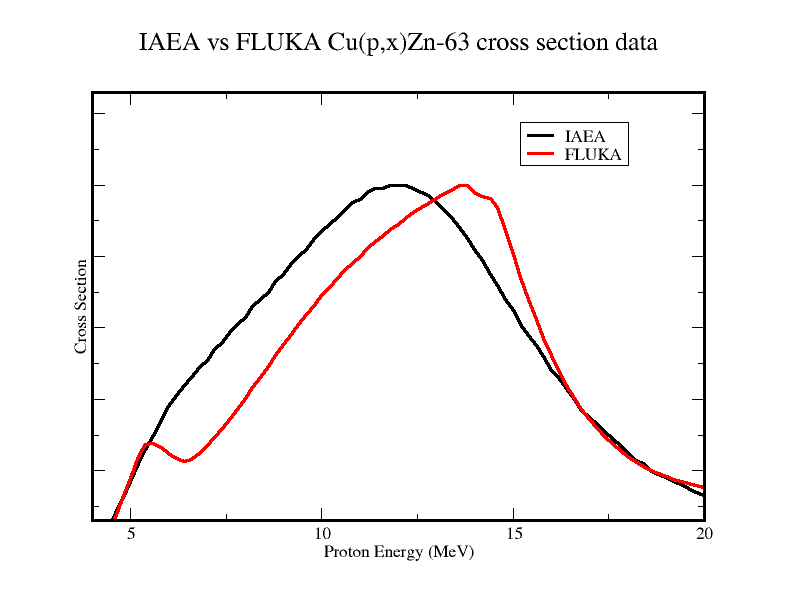
I’m comparing the experimental cross-section data of Cu(p,n) reaction with the one from FLUKA at low energy 0-20MeV. I noticed a new peak at 5-10 MeV. What are the possible causes of this peak? Is there LOW-MAT cross-section data for (p,n) reaction? if not, is this the reason for the discrepancies? Is there literature to back this up?
The LOW-MAT card is unrelated to (p,n); it sets the correspondence between FLUKA materials and low-energy neutron library materials for (n,*) reactions and elastic scattering below 20 MeV.
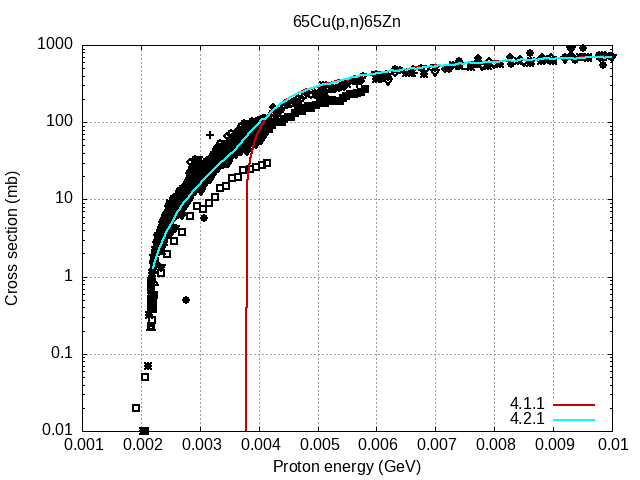
Looking back at the RELEASE-NOTES, the difference between FLUKA 4.1.1 and 4.2.1 impacting Cu(p,n) is the near-threshold refinement in the proton reaction cross section for {63,65}Cu. Incidentally, there was a typo in the RELEASE-NOTES (Co<->Cu) which we have spotted and fixed thanks to your post.
The 63Cu(p,n)63Zn yield is unaffected by this improvement, since the threshold for this particular channel is at around 4.2 MeV, well above where the aforementioned change applies.
Instead, for 65Cu(p,n)65Zn the improvement is visible in the excitation function at energies immediately above threshold (2.17 MeV), as displayed in the figure below. Note the cyan curve (FLUKA 4.2.1) is in better agreement with experimental data extracted from EXFOR (black symbols) in the near-threshold region than the red curve (FLUKA 4.1.1).
However, the improvement is rather between 2.17 and 4 MeV. In the 5-10 MeV domain that you quote I do not see a difference, neither in 63Cu(p,n) nor in 65Cu(p,n). Could you provide evidence? Specifically:
a plot displaying the alleged new peak and any necessary input files for your case study.
Where do you see the “new peak”? Comparing different FLUKA versions? Comparing against experimental data? Please clarify.
My apologies for the delay and thanks for clarifying (when you said “new” in your previous post I assumed you meant between FLUKA versions, where instead nothing changed).
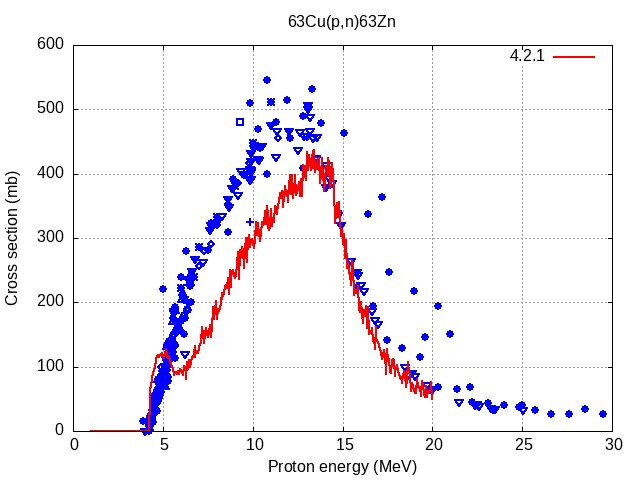
Indeed, for 63Cu(p,n) there is a local dip in the FLUKA excitation curve around 6 MeV comparing with the bulk of experimental data we could extract from EXFOR, as per the figure below:
At 6 MeV the (p,a) channel opens up and picks up too much intensity in FLUKA (judging from experimental data) in detriment of (p,n).
However the excess in (p,a) is not enough to make up for the difference with respect to experimental data in the (p,n) channel. Considering that the differences are quite localized in energy, we gratefully acknowledge them for the time being.