Dear @horvathd ,
My project maybe some bug because I get a very small “Cumul. Flux” in the file “xxx_sum.lis”. In my opinion, this value should not be so small, but I am not sure if it really have mistake.
I have checked several times and did not find any problem, could you take the time to help me take a look?
M+F.flair (3.4 KB)
M+F.inp (2.9 KB)
wvlnsh.f (2.9 KB)
Dear @xiongbp,
The sphere you defined for the FLOOD source is very large compared to the dimensions of the fiber and, therefore, a very small fraction of primaries will result in optical photons. In addition, given the fiber is very long and that it’s made up of materials with non-negligible absorption, it could be that very few photons created at any point in the fiber are transmitted to the region BLANK.
Dear @blefebvre ,
Thank you for your reply. The model is just like it(fiber absorption and length) and maybe there’s nothing error in my file,right?
Another problem is that even though the cumulative photon flux is small, it seems to change regularly with the length and diameter of the fiber, but it doesn’t. Why is that?
| fiber length | Cumul. Flux |
|---|---|
| 1 | 4.55E-03 |
| 2 | 1.29E-03 |
| 3 | 4.30E-03 |
| 4 | 2.65E-03 |
| 5 | 1.62E-03 |
| 6 | 3.50E-03 |
| 7 | 4.75E-03 |
| 8 | 3.46E-03 |
| 9 | 1.67E-03 |
| 10 | 4.28E-03 |
Dear @xiongbp,
Perhaps those are statistical fluctuations. Are the errors small compared to these flux variations?
Dear @blefebvre ,
I give almost 100000 primaries, but the cumulative flux does not vary with the length of the fiber, please just see my last message, it seems not reasonable.
Dear @xiongbp,
Regardless of the number of primaries that you generated, if only a small fraction of them end up interacting with your fiber you will get large statistical fluctuations. You will find the statistical error in percents next to “+/-” in the sum.lis file.
That said, beyond advising you to look at the statistical significance of your results, it is impossible for me to tell whether those results make sense of not. That would require an in-depth understanding of your detector construction and source which is beyond the scope of the forum.
Dear @blefebvre ,
Please let me give a brief description of my detector and its purpose, just see the first picture
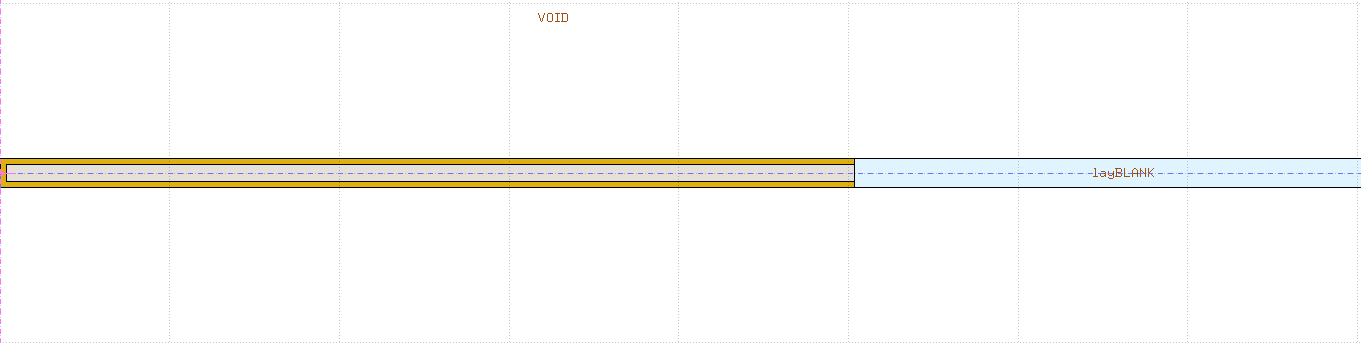
This is an optical fiber detector, the left part is wavelength-shifting fiber and covered with 6LiF/ZnS(Ag), right part is a region of air.
The source choosed FLOOD and covered the whole left part.
My purpose is to get total flux at the interface from left to right part at different length(radius) of wavelength-shifting fiber.
the sum.lis file is showed below:
M+F_22_sum.lis (1.5 KB)
Dear @xiongbp ,
The statistical errors shown in your sum.lis file are very high at 99%. This indicates that you likely ran just one cycle of your simulation. To adequately estimate the statistical error we recommend that you run at least 5 cycles.
Other than that, I cannot find any obvious problem the way your wrote your flair file.
Like I said before, we are not, on this forum, in a position to know whether your results make sense or not. This requires that you personally understand better your detector, which could be through laboratory measurements, material studies, analytical derivation, simulation parameter scans, literature review etc, all of which is obviously outside the scope of this forum. We can only advise on technical queries and issues related to the FLUKA and FLAIR software.