Dear FLUKA experts,
I tried to simulate carbon ions penetrated in a water phantom.
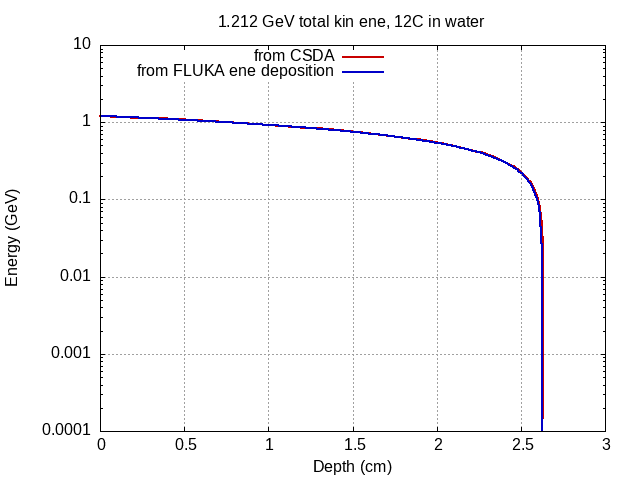
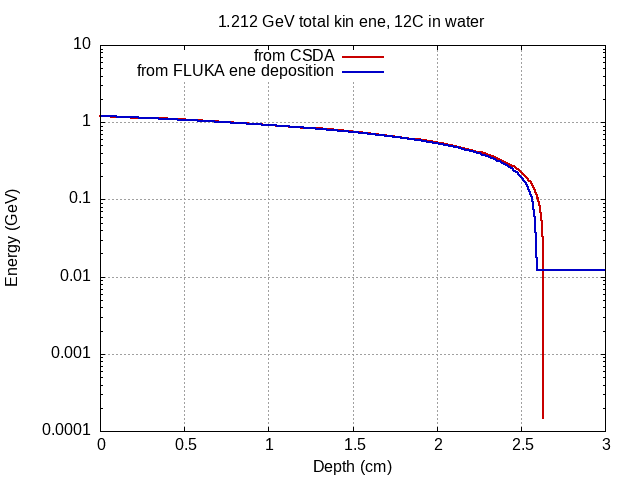
My aim is to check the consistency between the printed dE/dx values from the DELTARAY card and the depth-energy relation curves from FLUKA simulation.
I used the following settings in the .inp file:
STEPSIZE is fixed to 0.1cm (same as the voxel size in the z-direction)
IONFLUCT is switched off (no energy fluctuation for hadrons & electrons in a step)
EMFCUT for electrons transport is 10 GeV (electrons deposit energy locally)
MCSTHRES is switched off (no MCS, only along the z-direction)
THRESHOL is set to a very large value (no inelastic and elastic nuclear interactions)
PAIRBREM, inhibit both
In this case, to my understand, only CSDA and ionization (with delta electrons) happen, and carbons only move along the z-axis.
Here I performed a simulation of 100000 0.1 GeV carbon ions in a water phantom and plotted the depth-energy curves of carbon and electron, with the resolution of 0.1cm in the z-direction (same as the stepsize).
Second, I used the printed dE/dx values (from the DELTARAY card) and made interpolations to construct the restricted stopping power function L(E).
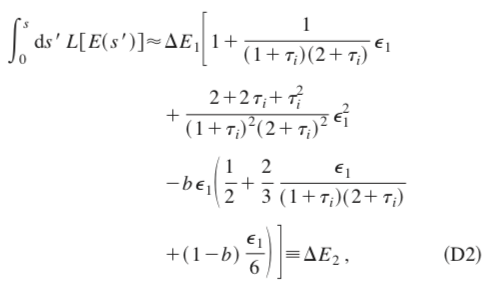
Third, I set up my own calculations, with initial energy 1200 MeV, the L(E) above, stepsize=1mm. The energy loss of CSDA in each step E_loss was calculated by Eq. (D2) of Ref. Kawrakow, Medical Physics 27 (2000) 485, which is proved to be precise enough.
Note that the energy loss of each step in my own calculation is actually
E_total = E_loss + E_electron,
where the latter is extracted from the electrons’ depth-energy curve of step 1.
However, results showed that my own calculations of the energy loss in each step (using the printed dE/dx values) is in general smaller than the FLUKA simulations. I’m not sure whether my settings in the .inp file are correct. My aim is just to check the CSDA and ionization processes without any other physics processes. I have attached the .inp file and my own calculations (using Mathematica).
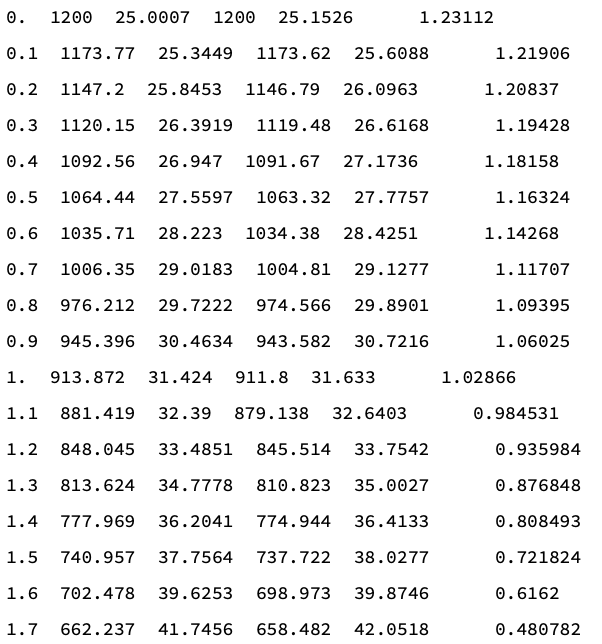
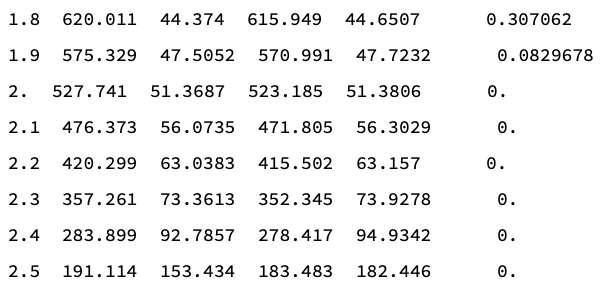
My own calculations, columns from left to right are
Depth(cm), current E (own), E_loss (own), current E (FLUKA), E_loss (FLUKA), E_electron (FLUKA)
Carbon_test.inp (1.8 KB)