Hello everyone,
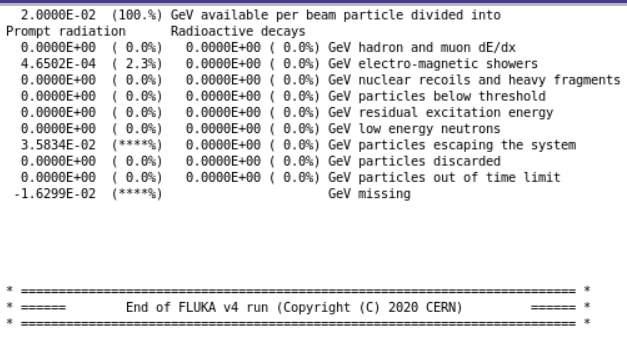
I have a beam of electrons with energy 20 MeV hitting a target. After the run, I saw that there is a negative missing energy which is due to the particles escaping the system.
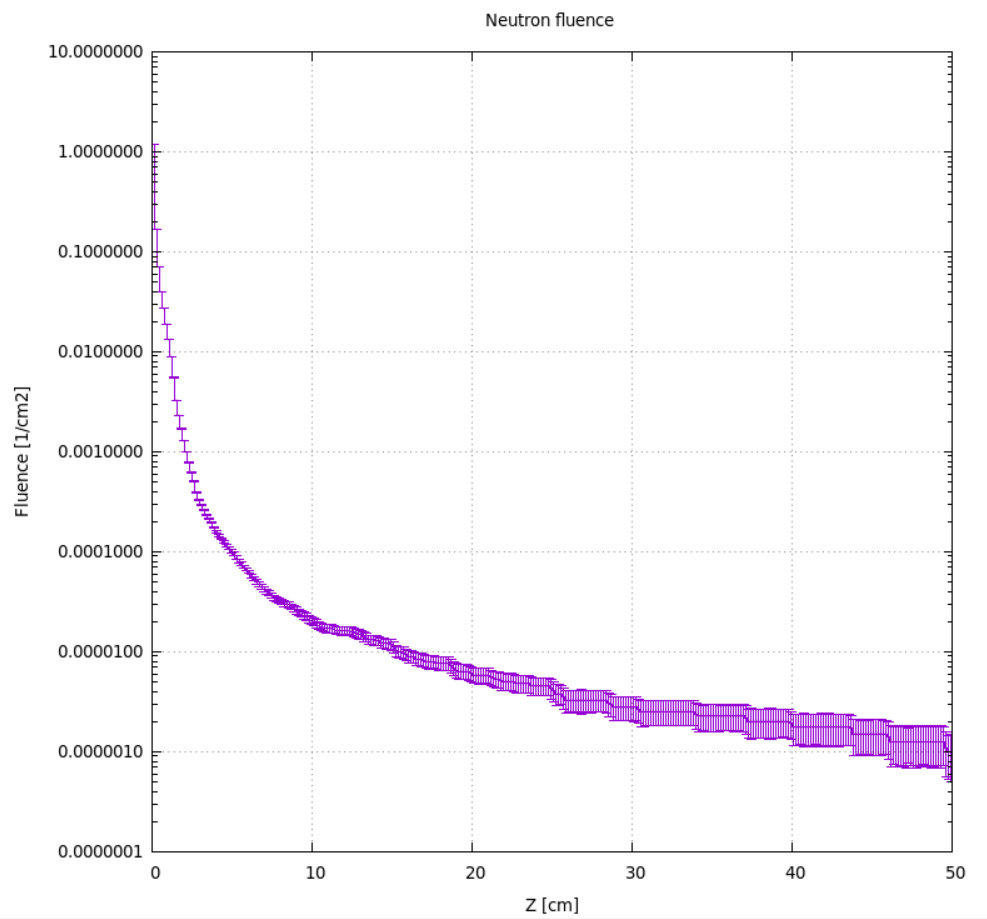
I have searched for the particles and the high energy neutrons escape from the system.
Is there a way to know what kind of reactions take place in the system that lead to the generation of neutrons and to an amount of energy that is higher than the intial energy (20 MeV).
Hallo @Singh, at first glance the results you report do not really appear to be logical. Can you please share your input file together with any user routine you may have used to produce them? Thanks
Thanks, your input fully clarifies the issue. You haven’t got a beam of 20 MeV electrons, since you asked for a Gaussian momentum distribution with a Full Width at Half Maximum of 82 MeV/c! Such a meaningless value, wrt the supposed mean energy of 20 MeV, generates a distribution that has actually a mean energy of 36 MeV (since negative kinetic energies obviously cannot enter into play). So, as expected for an electron problem, the missing energy (i.e. converted into mass, or gained from mass if negative) is actually negligible, while in the final table it appears to be gained simply because FLUKA considers there the supposedly mean energy of 20 MeV you declared.
Also, no neutron is generated at all (in your problem it’s impossible to get them in the absence of the PHOTONUC card). You relied on a scoring particle (NTLOWENE) that the manual indicates as not yet implemented, so the respective results are of no use (we are going to prevent Flair from offering it).
Finally, your geometry and source, even after removing the by far excessive momentum spread, will yield a large fraction of escaping energy, since you have a 0.05 cm material thickness along the y axis, while (in the BEAM card) you distribute the primary electrons over a 0.5 cm y-length.
Thank you for your reply, Sir.
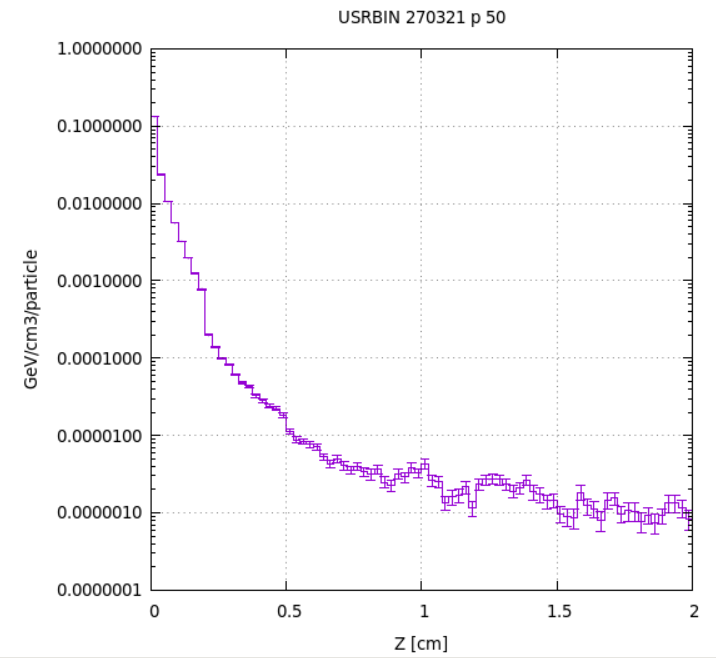
Now, I have made some changes in the input file: 270321_p.inp (3.0 KB)
I still don’t get why in the plot there are energies like 0.1 GeV/cm3 that are quite high with respect to 20 MeV. The volume should be 8x2.7x0.05 = 1.08 cm3.
The maximum energy density value of 0.15 GeV/cm3 is reached over a volume of 0.25 x 0.25 x 0.5 mm3, i.e. about 0.00003 cm3, and not homogeneously over the whole volume, as the resulting distribution clearly shows. This implies a local energy deposition of less than 5 keV, with respect to the electron energy of 20 MeV.
It’s the Cartesian mesh bin volume yourself defined by asking in the USRBIN card for 320 intervals from 16 to 24 cm along the x-axis, 1 interval from 19.975 to 20.025 cm along the y-axis, and 320 intervals from -4 to 4 cm along the z-axis, as also recalled in the Plot tab of Flair where you created the above plot, selecting the 1D Max energy density profile along z.
Thank you Sir.
So, if I understood well, to get the total energy deposited in the system, I have to sum the matrix in bnn.lis file and multiply the sum by 0.25x0.25x0.5 mm3?
And substracting this number by 20 MeV I should find the energy escaping from the system reported in the output file balance?