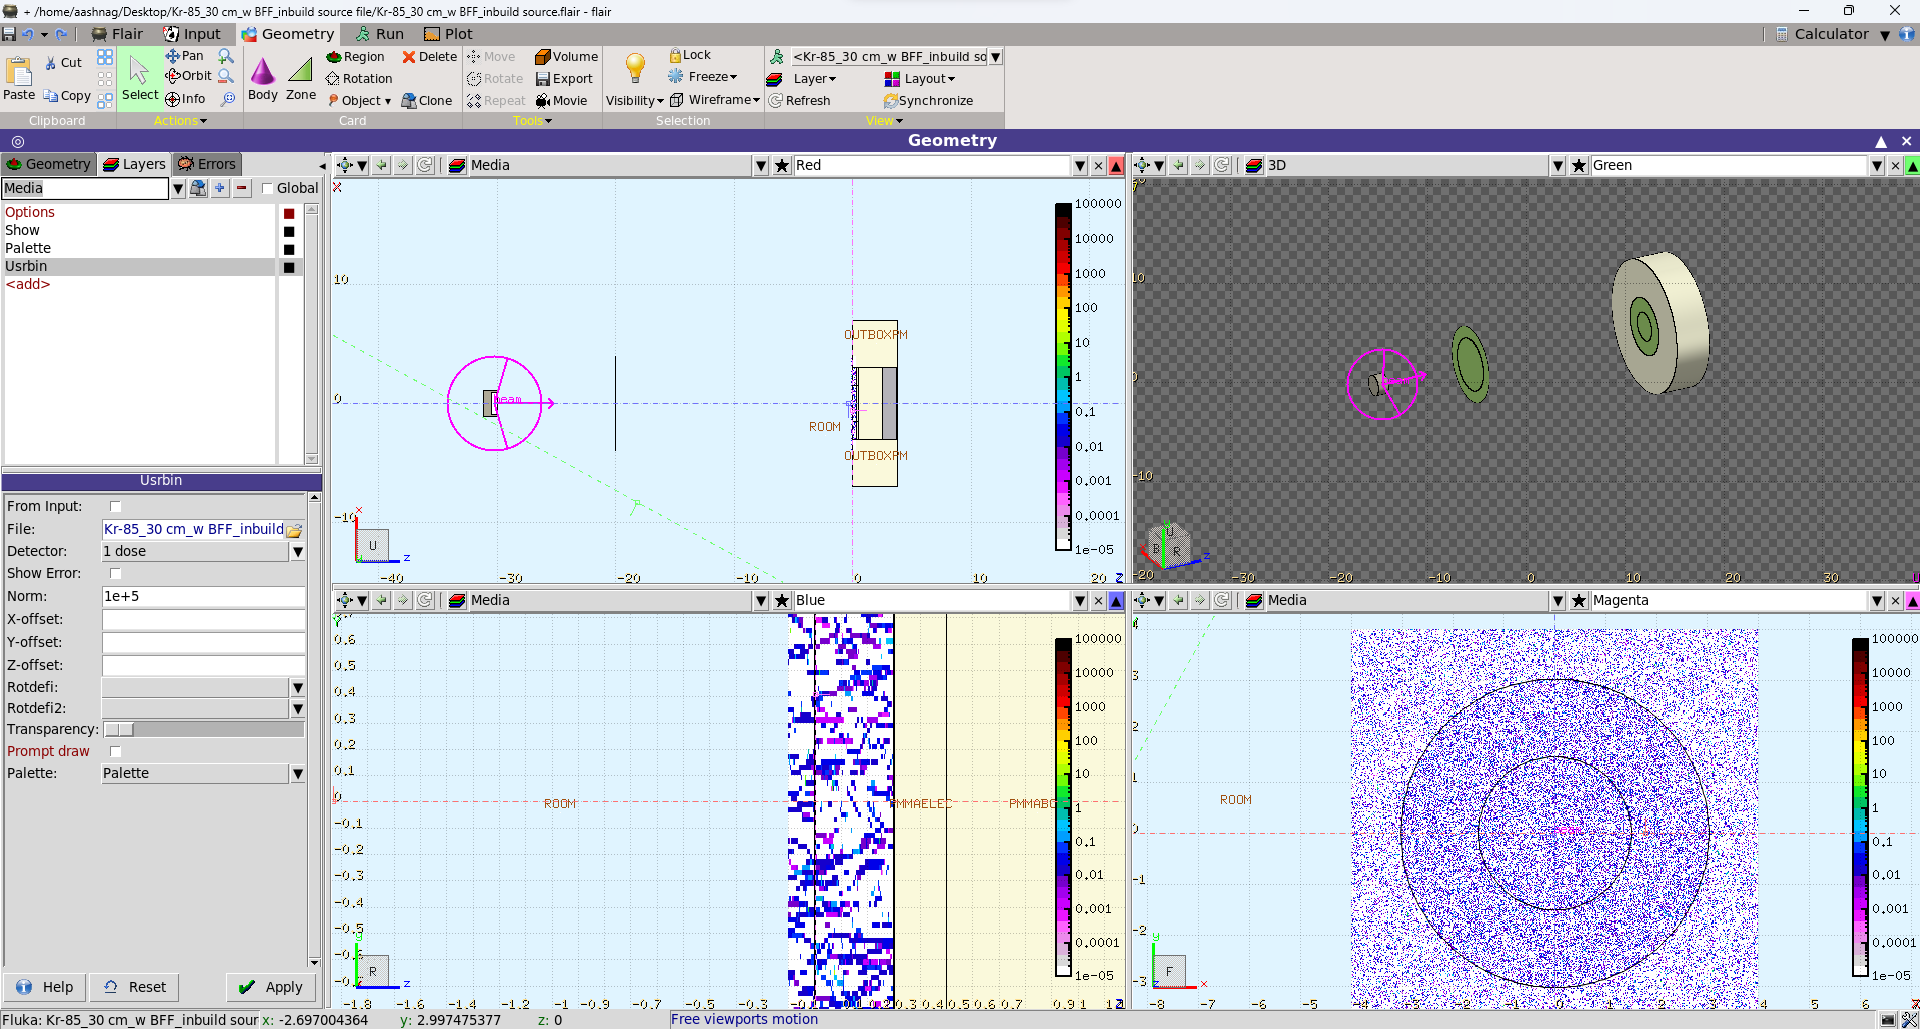
I want to know the radial distribution of dose on my cylindrical. I have used usrbin and taken r-phi-z binning but i see a region where it shows as if no dose is being deposited. But when i use x-y-z binning the dose is deposited everywhere. The same issue is observed when i score energy.
It seems like there might be issue in the way I am scoring. Can someone clear why this is happening. Also I want to know what do x, y and N-phi represent while scoring in r-phi-z binning.
Also i need to plot dose distribution along radius. since my target is at centre, i need the plot from (-4,4) but since the radius cannot be negative, i only get plot from (0,4). How do i get plot from (-4,4) in radial direction.
Solely from the screenshots I cannot tell why you do not score anything in the center. You could check the range of the palette used to display the results with the layers. Perhaps the low-value is too high. If that does not work, please attach a flair file.
x and z are the coordinates of the center of the base of the “scoring cylinder”. When setting (x,y)=(0,0), you will score at the origin. The z-range is specified in the card. N-phi is the number of azimuthal bins.
By definition the radius in a cylindrical coordinate system can only be positive. But if you want to see the scoring at different azimuthal angles, you can use multiple phi-bins. If you had 4, for example, you could score something as a function of the radius in each of the quadrants.
Kr-85_30 cm_wo BFF_inbuild source.inp (4.4 KB)
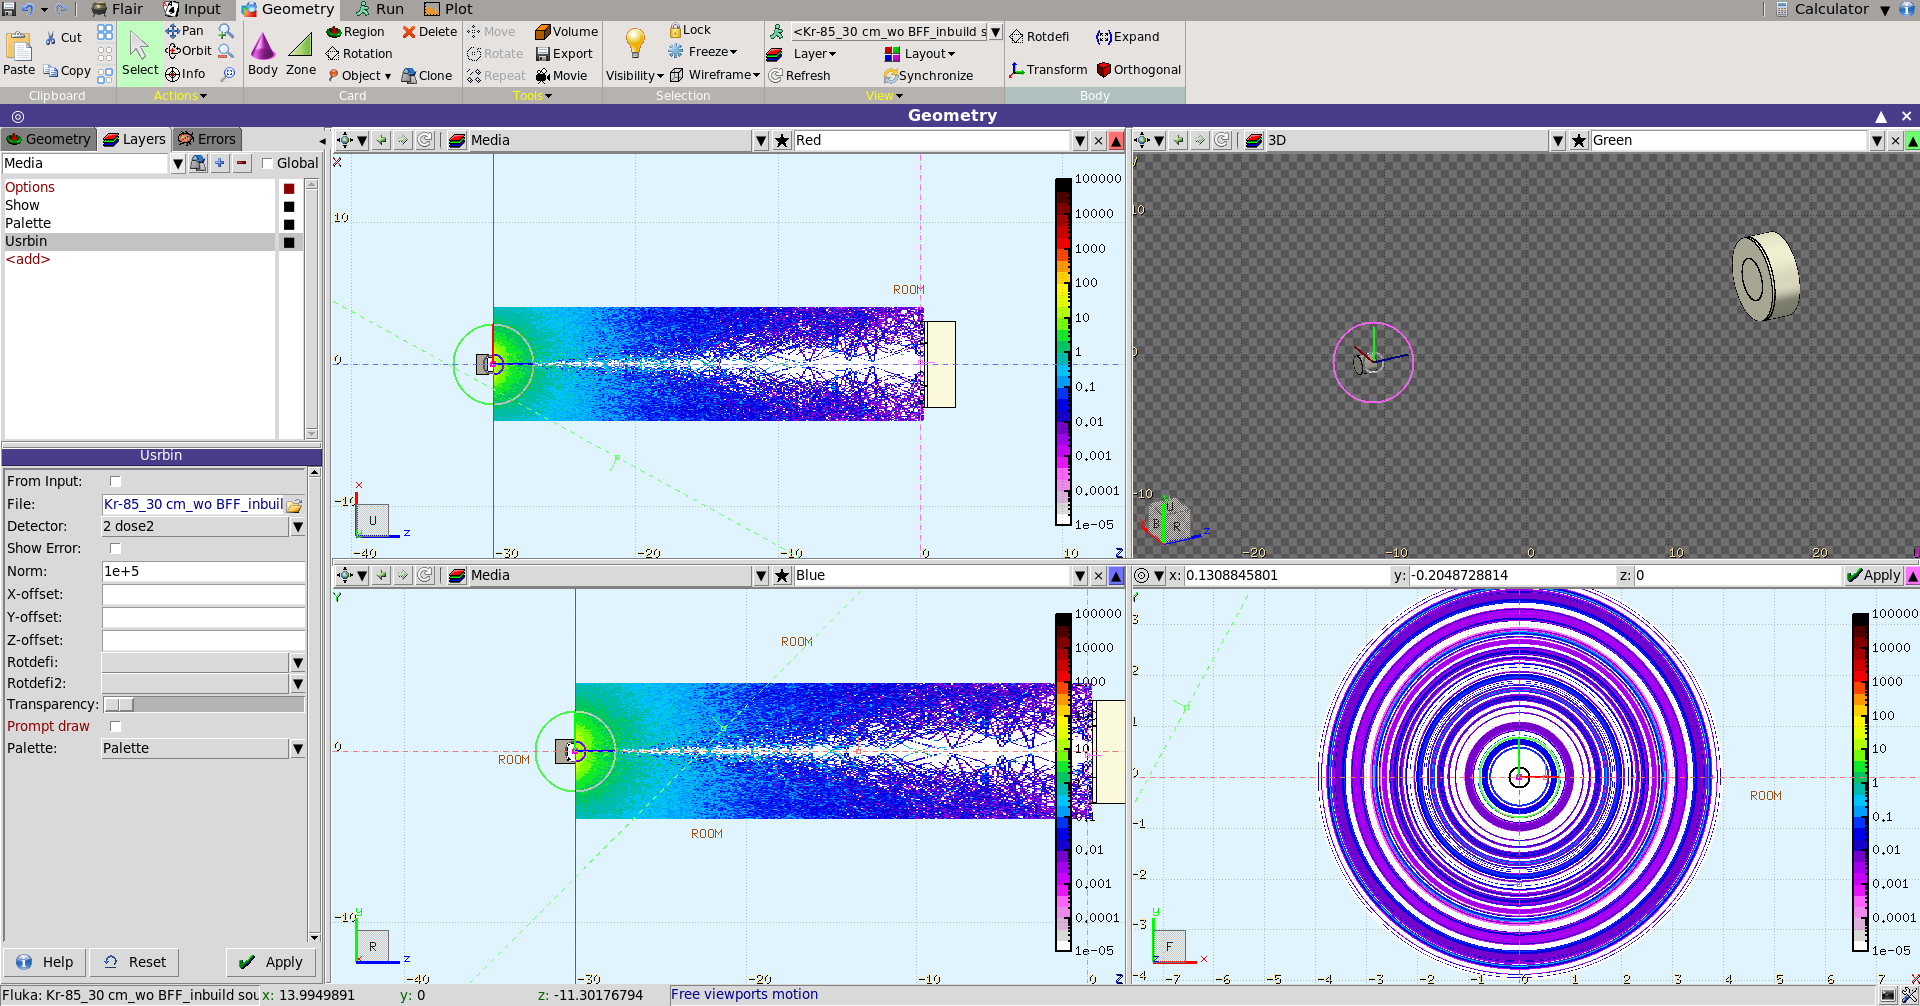
For my first question i have attached the files. Also as can be seen in the image attached, there is no dose deposition way before it is deposited in the target.
My second question is cleared up
I still cannot plot 1D plot for Dose v/s Radius such that R goes from (-4,4) when i can azimuthal angle. It still goes from (0,4).
This is really a problem of insufficient statistics. Consider that the central bins, at r=0, are the smallest in volume and, therefore, have the lowest probability of being traversed by a track. Add to this that you have an isotropic source, necessarily you will score very little far from the source at r=0. I noticed that you are using a very large number of bins: 300x400. Try with larger bins and you will have better results.
As for the plot in r, you can produce 1D-projections in the plot tab in Flair. There, select the appropriate phi cut for plotting. Flair will generate a dat file in the working directory. Then, after you have generated the two dat files for the two values of phi you are interested in, you can parse them and generate a plot with an external graphing software of your choice.