Dear fluka experts,
When I use usrbin card to calculate the carbon energy desposition in the water target, I want to normalize it in flair interfacecarbon.inp (1.9 KB) . But I don’t know what the norm factor is. Do I multiply 1000 to convert it form Gev/cm^3/particle to Mev/cm^3/particle? In addition, the plot result is different to MCNP result when carbon energy is 100Mev/u
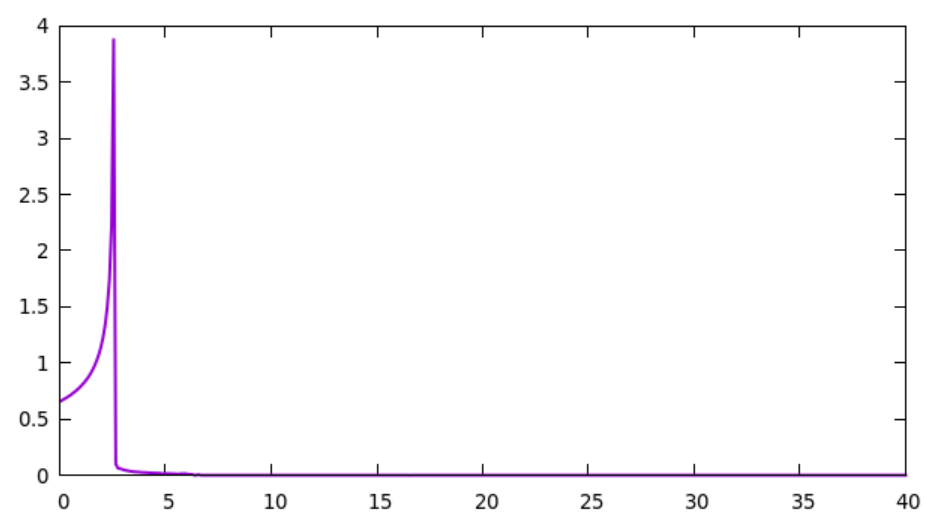
I suspect you produced the FLUKA plot via Flair with a 1D projection along z. Note that this is an average over the XY plane. The units are GeV/cm^3/primary. You then multiply by 1000 to get in MeV/cm^3/primary, like you did.
If you now want to get the energy deposited per cm (in MeV/cm/primary), you would multiply by the area of the USRBIN along XY, in your case 20 cm x 20 cm = 400 cm^2. The numbers then become comparable to those in the second plot. There’s a further factor 10 that’s not clear to me now. Could there be some mm<->cm issue in your workflow?
Hi, cesc,
Thanks for your response. The value in my figure is different from the second plot, even though I multiply by 1000 to get in MeV/cm^3/primary. I want to know where the difference is in MCNP and fluka program to get the Bragge peak. Meanwhile, I want to know how to get the “normalized dose”, “relative dose” in the bragge curve though setting the Norm value in flair. Thanks in advance.
When you plot an energy density or dose profile as a function of z (i.e. the target depth along the beam axis), you are actually averaging (the deposited energy density) over a transverse xy area, as Cesc pointed out. The choice of the latter is not at all innocent and, before comparing, one should be well aware of what he’s doing. Your plot has been obtained by averaging over a 20x20 cm^2 area, for a beam size of 4x4 cm^2. If you limit it to the central 2x2 cm^2 area (indicating the x/y limits in the Flair plot frame, or selecting 1D Max instead of 1D Projection), you will see a value 25 times higher, i.e. 100 MeV/cm^3 per carbon ion. For a smaller beam size and with an appropriately increased scoring resolution, i.e. more bins implying smaller bins (by the way, it’s wise to select an odd number of bins in x/y, to get the central bin on the beam axis), you will get values higher and higher. So, if you want to compare FLUKA and MCNP, make sure to use the same beam size and the same scoring resolution in the transverse plane, which is patently not what you did.
Note that, when the Bragg peak is referred to, one often considers a transverse area as large as to include all energy deposition and plots the linear energy density in MeV/cm, as Cesc suggested by multiplying the Flair 1D Projection by the considered transverse area.
Best regards
Francesco