Dear fluka experts,
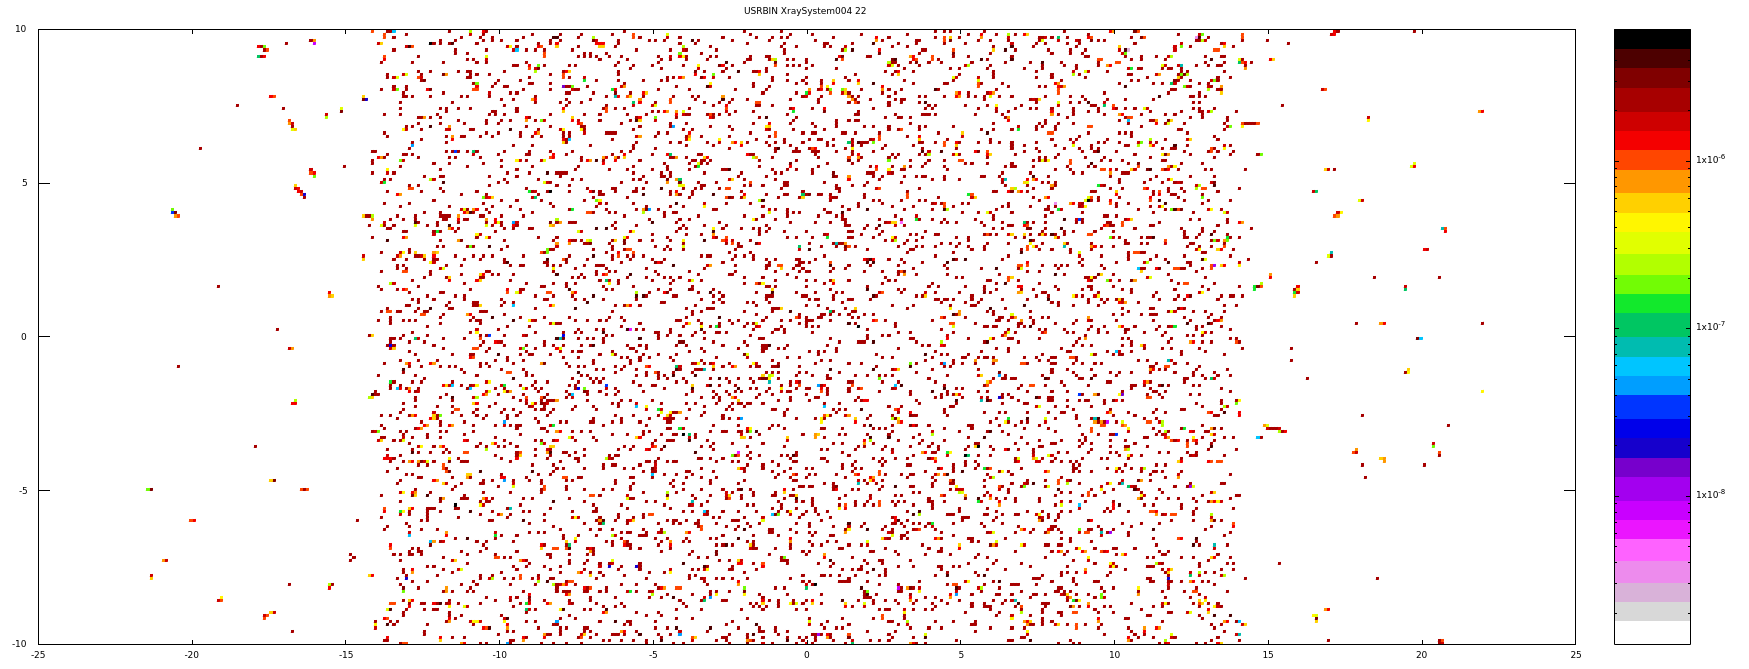
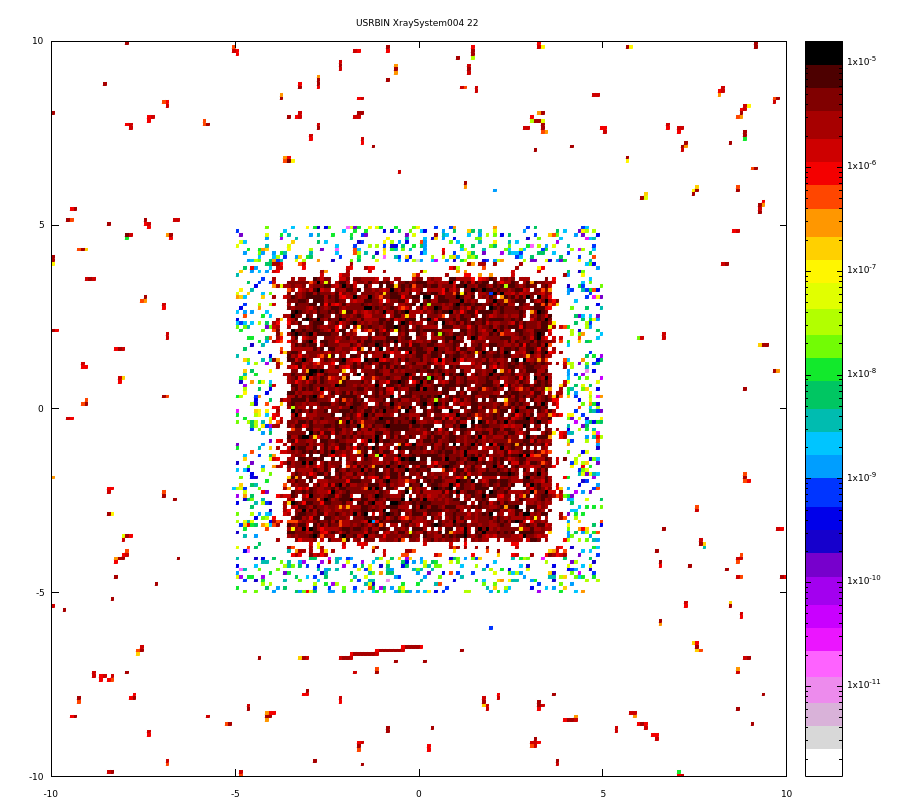
I’m running a simulation of Bremsstrahlung,I set up two EMFCUT cards to set the photon and electron generation and transmission thresholds.I have two usrbin to score the photon distribution at different locations (very thin bin width and only one in the Z direction), and the other usrbdx cards to look at the photon flux spectrum.Although I have been getting some results, I feel like what went wrong.The projection results of the two Usrbins do not seem to be quite correct.As shown in the picture below,especially the first one(picture 1 represent “downph”, picture 2 represent “tubeph”)
1、I think the number of particles is enough (1,000,000 5Spawn10cycle), why is usrbin’s score so discrete
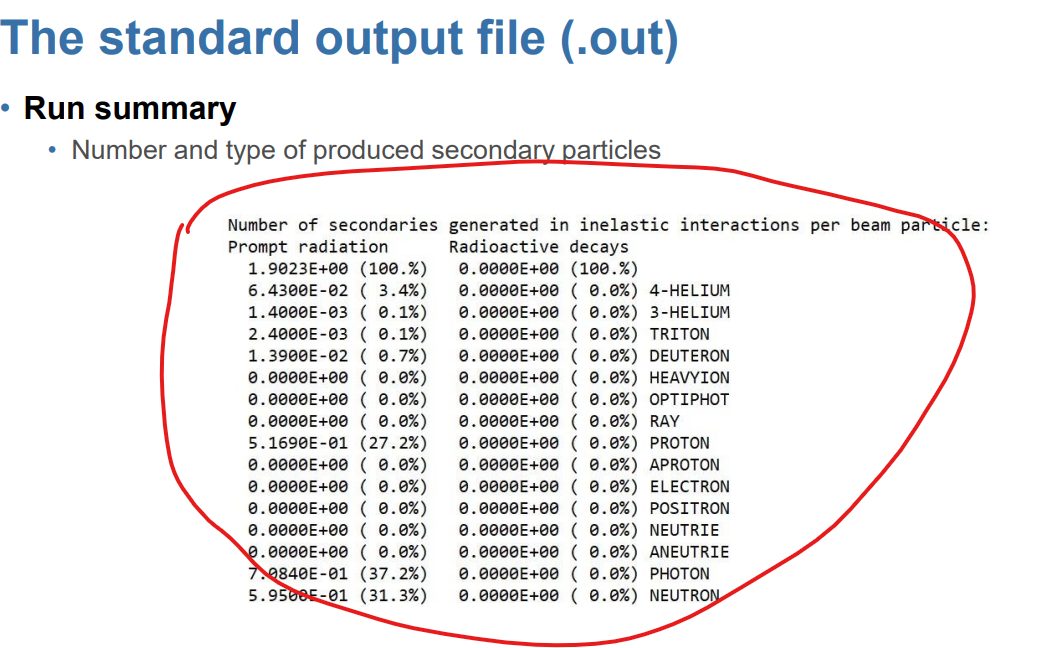
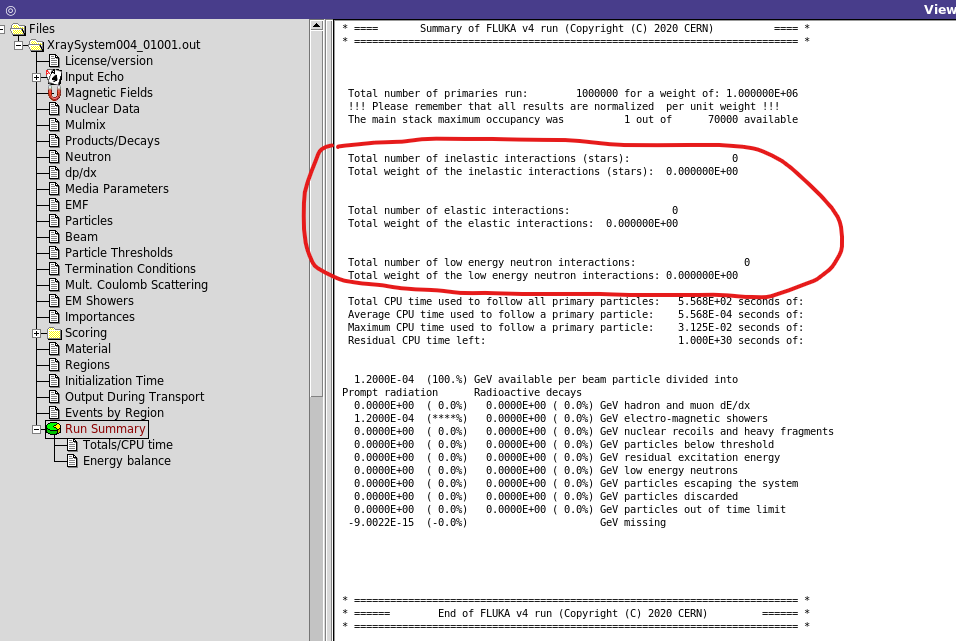
2、On the other hand, I went to the.out file and found that there was no record of the instance result in the document,like this
It looks like you are plotting the energy deposition inside vacuum or inside air, which are not really the best medium for energy deposition…
I would suggest to either lower your transport/production threshold and apply them to all of your regions/ materials (which are now only roughly at 1/10 of your beam energy for electrons) or to increase the size of your bins.
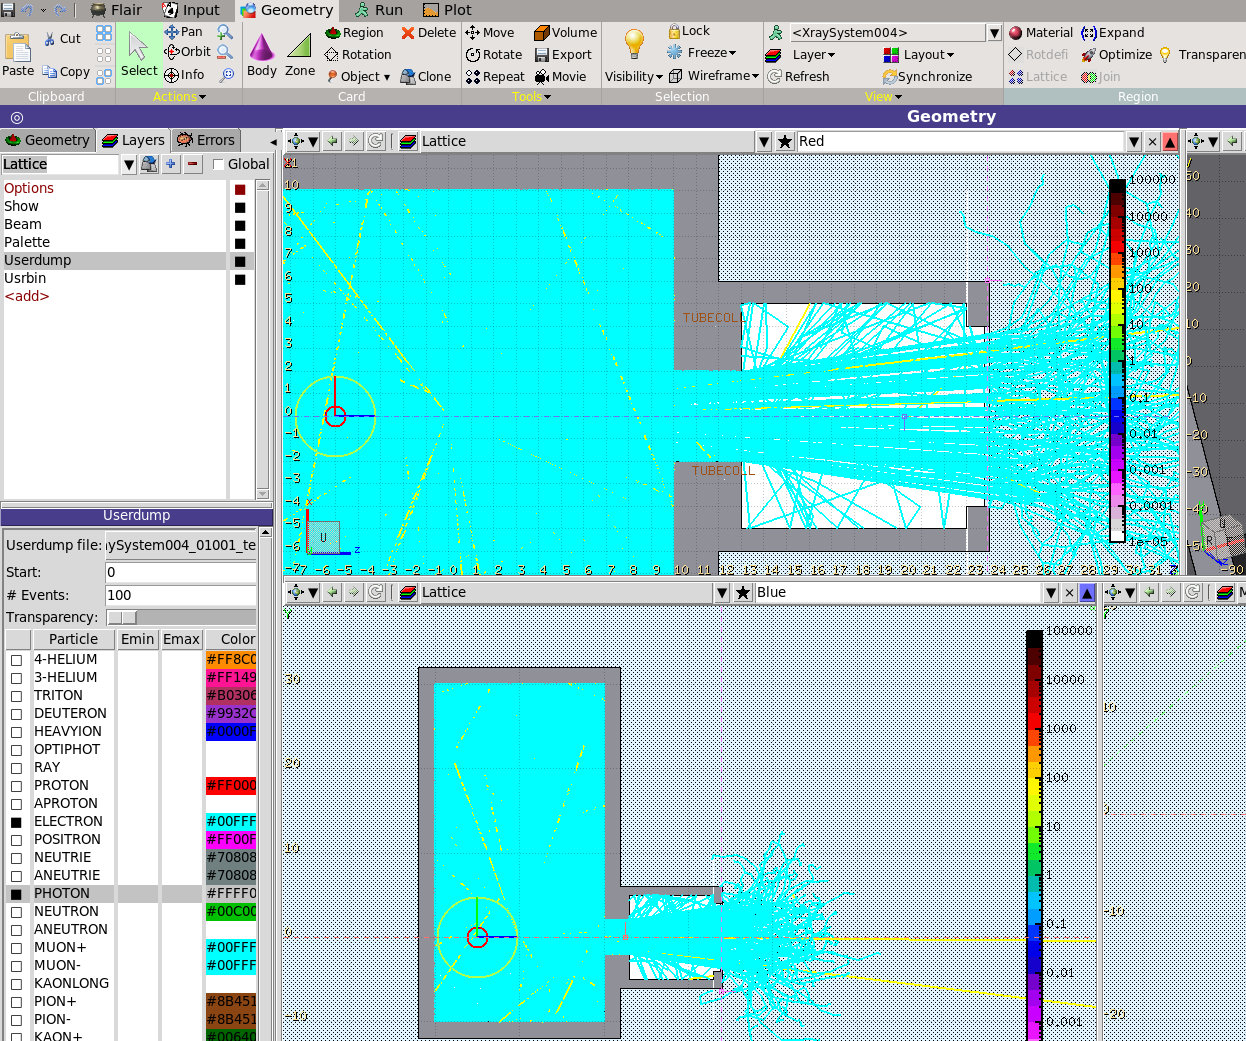
If you want to visualize a bit more what is going on in your geometry I invite you to use the card userdump.
then in flair you will be able to visualize the trajectory of the produced photons/electrons.
Dear @jpotoine
I apologize for replying so late. My original goal was to get the spatial distribution of the X-rays as they pass through the phantom, but now I want to look at the distribution of the X-rays before they enter the air (tubeph) and the phantom(downph).But my results (as shown in Figures 1 and 2 above) show that these photon distributions are very discrete. I wonder why
I will consider the usrdump card you mentioned,the result of this visualization is also helpful to me.(In addition, I found in the picture you uploaded that there are only trajectories of electrons here (blue) and no photon display (gray).)
Dear ceruttif
Sorry I’m late.
My knowledge of particle physics is poor,according to your reminder, how can I get data on the bremsstrahlung radiation produced by the electron beam hitting the tungsten target and the secondary particles scattered by photons.(PS: I did some research, Bremsstrahrig radiation and photon scattering are inelastic interactions, right?)
The discrete image indicates that the run statistics is not adapted to the requested scoring bin size, as @jpotoine indicated. To keep the latter, you need to run many more particles.
What inelastic interactions (stars) mean in the output file is nuclear reactions, which bremsstrahlung and photon scattering are not.
The USRBDX cards give you photon (and electron) spectra at the selected boundaries between regions, and their integrals (as in the resulting sum.lis files) are the number of particles.