I am writing because I’ve some issues with my first FLUKA simulation and to ask for help with a discrepancy between my simulation results and experimental measurements.
I am simulating an Air Contamination Monitor consisting of a complex volume filled with Carbon-11 gas, surrounded by 6 pancake Geiger-Müller detectors (LND 7311 with a thin mica window). To sample primary particles uniformly inside the complex source volume, I wrote a custom source.f Fortran routine.
My goal is to estimate the total net beta (positron) count rate of the setup. However, my simulation overestimates the real experimental count rate by two orders of magnitude (for a given activity concentration, the physical detector measures ~700 cps, whereas FLUKA yields ~60,000 cps).
Here is my post-processing workflow:
I use 6 DETECT cards (one for each active volume region).
Since the first bin covers 0 eV to 32 eV (the W-value of the detector gas), I discard events in this bin to exclude zero-energy depositions and sub-threshold events.
I sum the frequencies of all remaining bins to obtain the absolute efficiency for each detector: eff_det = sum(bin_frequencies).
Among the 6 detectors, 4 are uncovered (sensitive to beta + gamma) and 2 are covered (sensitive to gamma only).
I calculate the net beta efficiency as:
eff_uncovered = (eff_det1 + eff_det2 + eff_det4 + eff_det5) / 4
eff_covered = (eff_det3 + eff_det6) / 2
eff_beta_tot = eff_uncovered - eff_covered
Finally, I calculate the count rate as:
Count Rate [cps] = eff_beta_tot * Volume [m^3] * Activity_Concentration [Bq/m^3]
To ensure accurate low-energy electron/positron transport near the active volumes, I set EMFCUT transport thresholds down to 1 keV for e-/e+ and 10 eV for photons in the MICA and active volume regions.
My primary questions are:
Is my interpretation and usage of the DETECT card correct for estimating counting efficiency?
Is the sum of bin frequencies (excluding the 0-32 eV bin) directly equal to the event probability per primary history (N_interacted / N_primaries)?
Am I missing any normalization factors inherent to the DETECT card or RADDECAY/source treatment?
I have attached my ACM.flair, ACM.inp, and source.f files.
Thank you very much for your time and assistance! In the meantime, I wish you a nice day and weekend!
PS: As an example, first 2 rows of results from DETECT card in detector 1 (uncovered) [the number in the 3rd column is what I don’t fully understand]:
Dear Daniele,
the 3rd column of the DETECT output (associated to the unit 17) gives the fraction of 11C decays contributing to the respective energy bin. In principle, the sum of all frequencies but the first should be equal to (1 - 9.859E-01) = 0.0141, being 9.859E-01 the first bin value.
I understand that the simulated volume is of the order of 0.004 m^3.
What’s the activity concentration?
To provide the exact numbers from my simulation extracted from the DETECT scoring:
- Mean efficiency for uncovered detectors (beta + gamma): eff_uncovered = 0.014046; - Mean efficiency for covered detectors (gamma only): eff_covered = 0.0001488; - Net total beta efficiency: eff_beta = eff_uncovered - eff_covered = 0.013897
The experimental activity concentration ranges from approximately 2.7E+6 kBq/m^3 (2.7E+9 Bq/m^3) down to near 0. With a source volume of V = 0.0014073 m^3 (1407.3 cm^3) and eff_beta = 0.013897, the simulated net beta count rate at the highest concentration is: Count Rate_sim = 0.013897 * 0.0014073 m^3 * 2.7E+9 Bq/m^3 ~ 52,800 cps
Even when accounting for dead time corrections (minimum dead time tau = 40 microsec for the 7314 pancake detectors in a non-paralyzable model), is not sufficient to bring the counts down to the real values, which are consistently 2 orders of magnitude lower (around ~600 cps in the experiment).
If the post-processing and DETECT scoring methodology to evaluate the efficiency of Geiger-Muller detectors in FLUKA are correct, what could be causing this huge gap?
Could it be related to the gas density/pressure in the source volume (defined as standard AIR in my simulation but this assumption may not match the real experiment conditions) or differences between ideal FLUKA ionization energy deposition and real GM intrinsic detection efficiency?
Additionally, it is worth noting that the gamma component predicted for the covered detectors matches the real experimental data in terms of order of magnitude (at maximum activity concentration, FLUKA predicts ~590 cps for covered detectors, while the experimental measurements show slightly above ~100 cps). So it’s seems like the huge difference is given by positrons in the uncovered detectors.
Dear Daniele,
an expectation of 50,000 cps implies one count every 20 microsec, which may be significantly below the actual detector time resolution, making the direct comparison inapplicable for such an activity concentration.
You’re completely right about the dead time, I’ve tried to correct my results with the non-paralyzable response equation R_measured = R_true / (1 + R_true * tau) across the whole array of activity concentration applied to every detector, where tau = 40 microsec, but at the end even with that correction, at 50000 cps, I obtain ~16000 cps, where the real detector counts 600 cps.
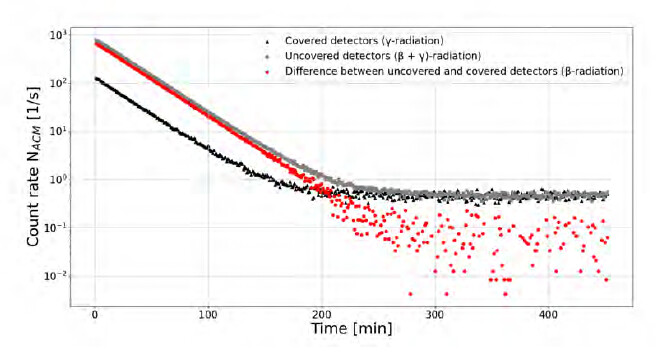
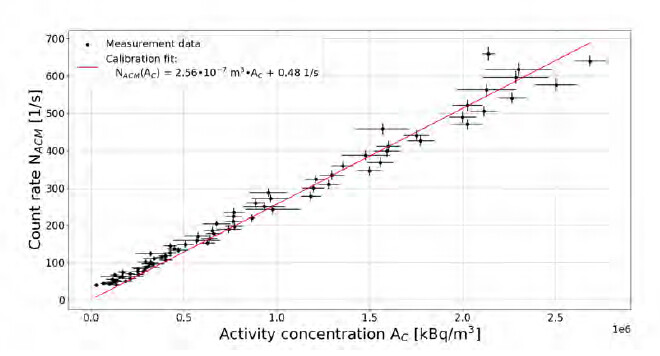
Furthermore, I’ve analyzed the results of the real experiment and the real detector doesn’t seem in a saturation regime even at the maximum activity concentration. I’ve attached the graphs of the real experiment to better explain the situation:
the measured count rate is linear with the activity concentration up to the maximum value of 2.5*10^6 kBq/m^3 (reaching max ~600 cps).
For that reason I think that the huge discrepancy can’t be explained by the dead time, but it must be something more deep in the simulation. And also, my simulation and experimental results for the covered detectors (gamma only) are within the same order of magnitude (~600 cps in FLUKA vs. slightly above 100 cps experimentally).
I would like to ask some questions regarding FLUKA methodology and transport physics:
Is evaluating detection efficiency just by summing the 3rd column of all the bins (besides the first bin fixed at W-value estimated for my gas mixture) the correct and standard methodology for geiger muller detectors in FLUKA?
Could DETECT card be overestimating efficiency due to multiple hit scoring per primary decay?
Could setting EMFCUT at the FLUKA limits (100 eV for photons and 1 keV e+/e-) be too permissive or introduce numerical artifacts in small gas regions. For example, it forces explicit tracking of very low-energy electrons across thin boundaries. Could this introduce boundary-crossing artifacts or step-size issues at the thin mica-to-gas interface, potentially altering the energy deposition profile in the active volume?
Are there other scoring methods more suitable than DETECT for this specific setup? Alternatively, could specific transport parameters affecting positrons be responsible for inflating the results, given that the discrepancy appears to be almost entirely isolated to the positron channel?
If you or anyone in the community has any suggestions or insights on these points, I would be very grateful!
Thanks again for the time and the help and I wish you a great day and week!
Hi Daniele,
by construction, DETECT gives only hit per primary decay. Also, the low thresholds you properly implemented give in principle the most accurate treatment.
What about the role of photons from positron annihilation?
Thank you for your reply and for confirming that the DETECT scoring method and the transport thresholds are correct.
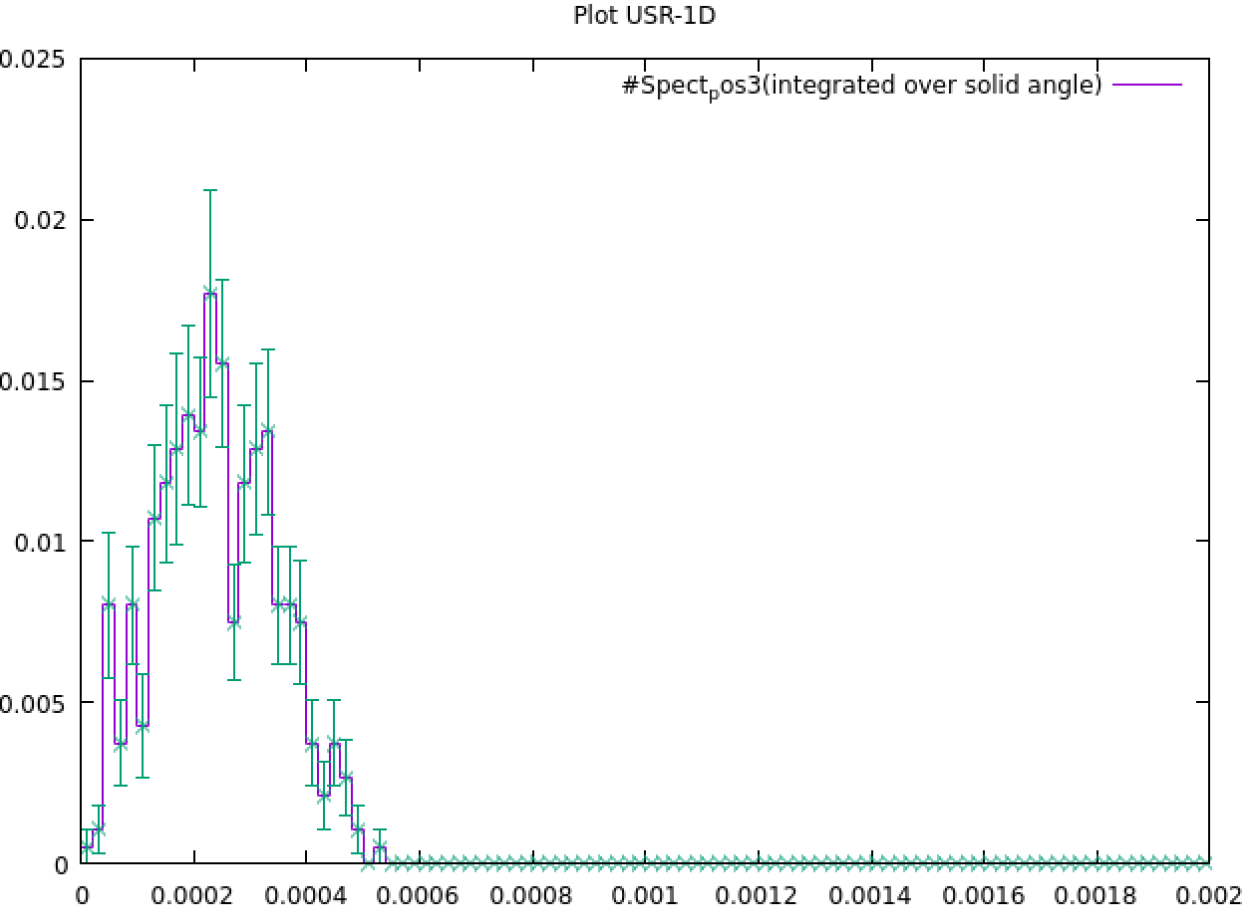
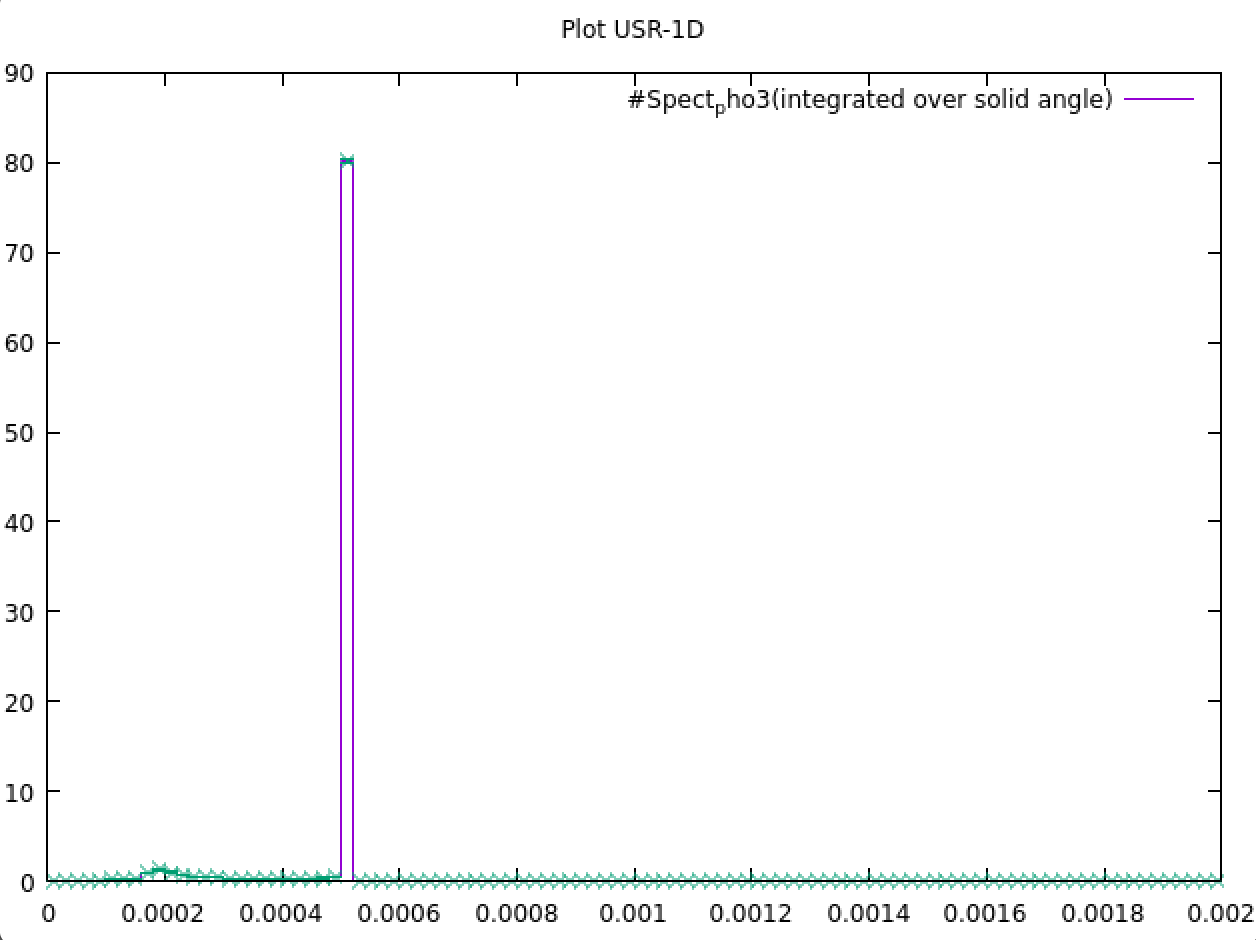
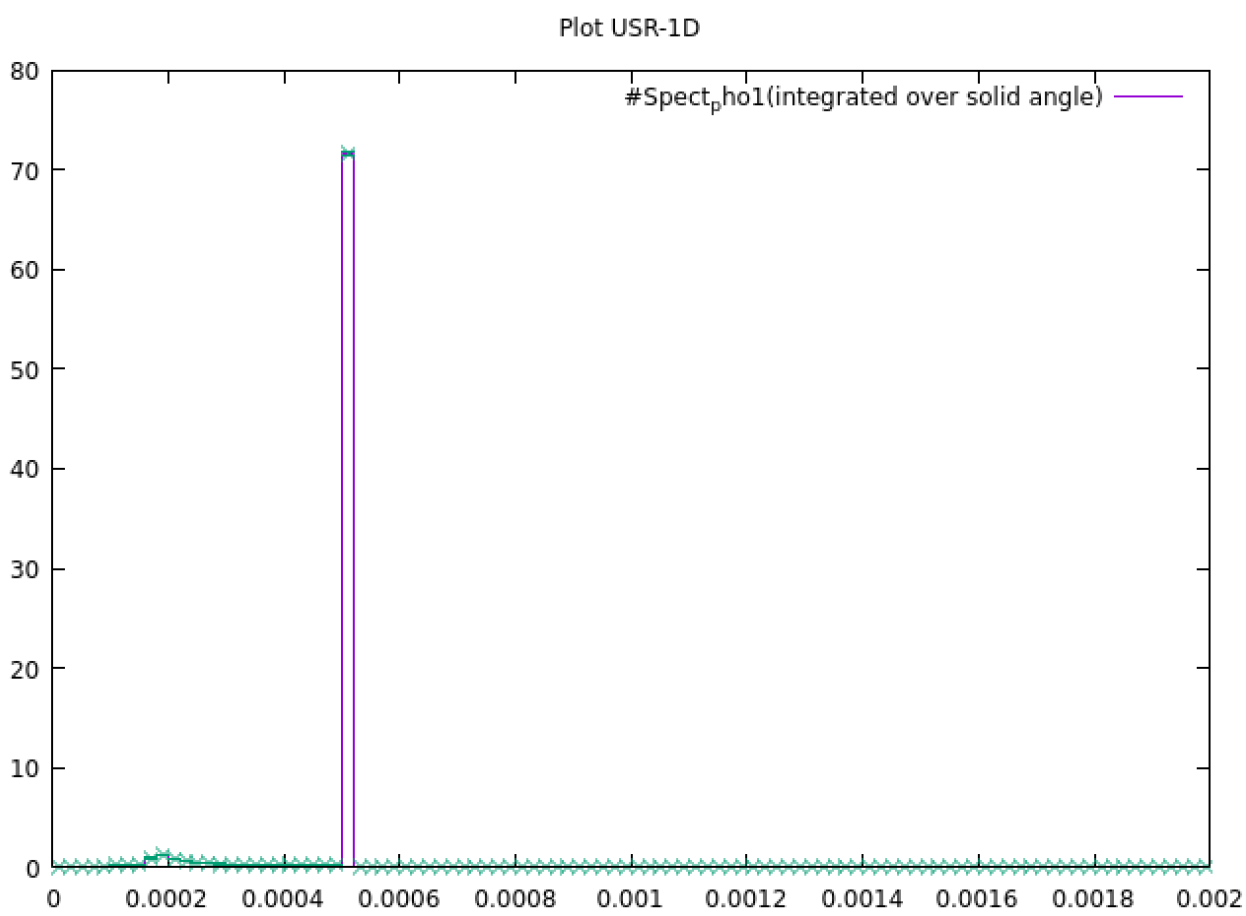
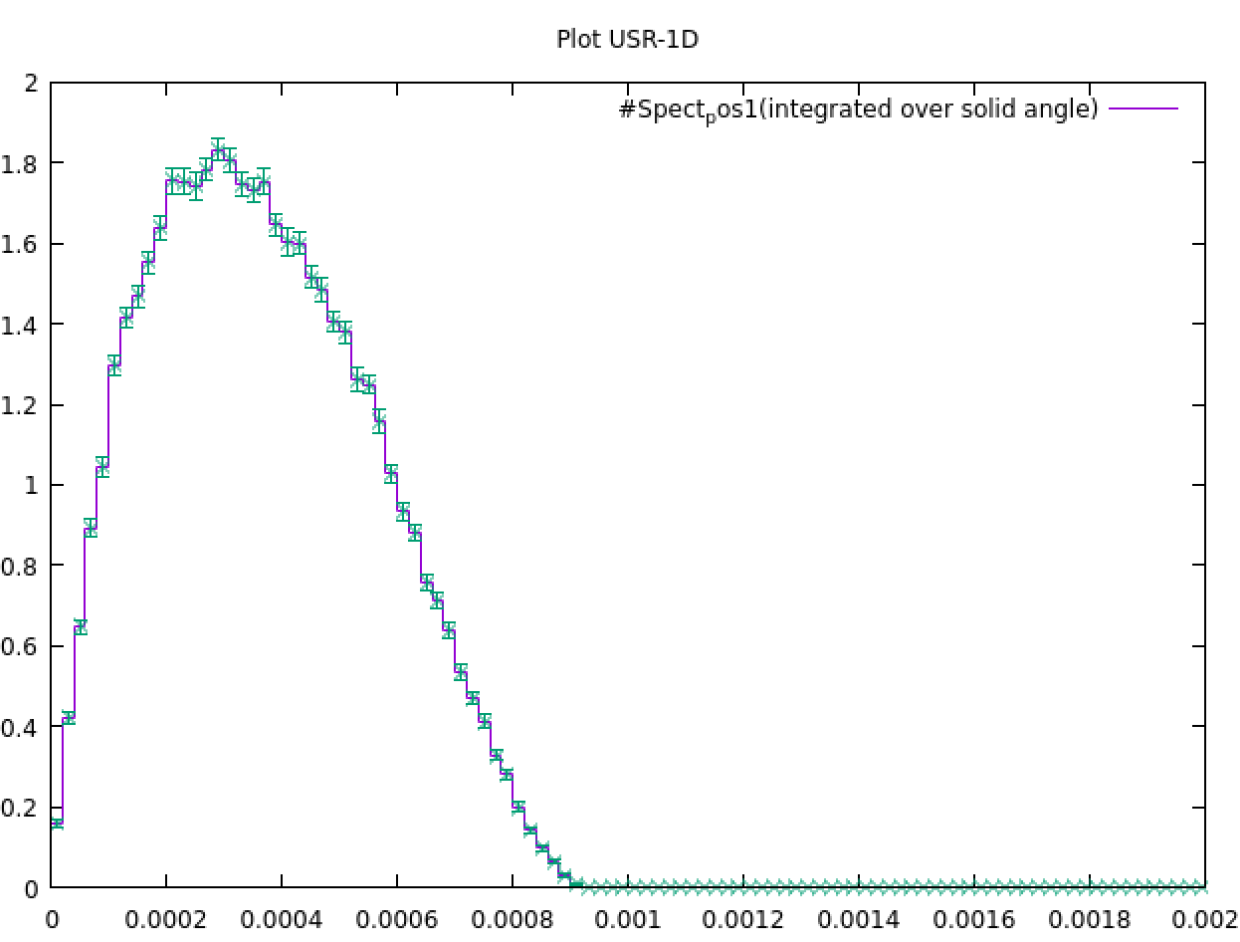
Regarding the role of annihilation photons, I attach the USRBDX spectra (positrons and photons, MICA → active gas, one-way current) for one uncovered detector (Det1) and one covered detector (Det3, 1 mm Al plate):
The photon flux crossing the window (dominated by the 511 keV annihilation peak) is about the same for covered and uncovered detectors, slightly lower for the uncovered one.
The positron flux is very different: the uncovered detector sees essentially the full ¹¹C β⁺ spectrum, while only a small residual fraction gets through the Al plate of the covered detector.
Since photons interact very rarely in the gas, the photon contribution to the counts is small. This is visible from the efficiencies in one of my latest runs: about 1.49·10⁻⁴ for the covered detectors versus about 1.40·10⁻² for the uncovered ones. The signal of the uncovered detectors is therefore clearly dominated by positrons.
As a next step, I will validate the photon response of a single LND 7314 tube by simulating a Co-60 irradiation and comparing it with the datasheet gamma sensitivity, to check whether any part of the detector model can be improved. After that, I will check the real detector hardware to make sure everything is working properly.
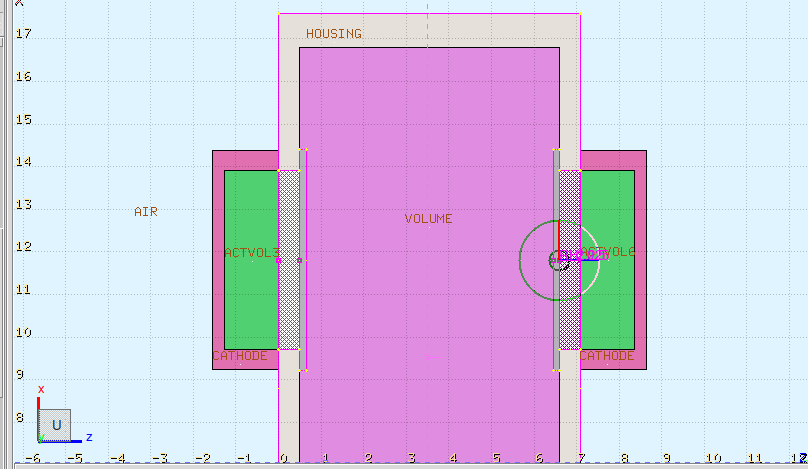
When running your simulation, I found that your source routine also samples 11C decays in zone03 and zone04 of the VOLUME region (see screenshot, the two zones are highlighted with a criss-cross pattern). These are the small spaces between the aluminium shielding and the MICA windows of the shielded detectors 3 and 6. It would mean that there are positrons going directly from VOLUME into the detector without passing through the shielding. When considering the discussion above, I don’t think this is how the system works in reality.
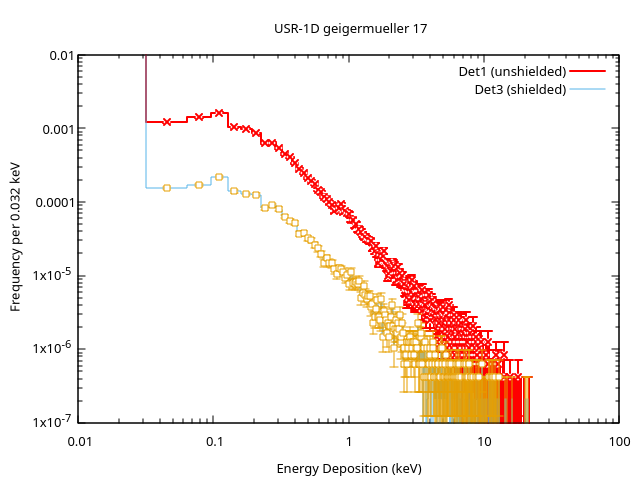
This is also confirmed by the energy-deposition spectra (scored with your DETECT cards) in -for example- detector 1 and detector 3, which have exactly the same shape up to a scaling factor (see screenshot).
If the counts in Det3 were solely caused by photons, the spectral shape should be quite different due to the different energy-loss mechanisms and incoming-particle spectra.
In the foregoing discussion, it was always assumed that Det3 and Det6 only count photons. However, I think that even Det3 and Det6 are almost exclusively counting positronic energy depositions. The count rate is just lower because the positrons are coming from a small part of the entire air-filled VOLUME.
Even if my suspicion is correct, it would not answer the original question why the detector rates are overestimated by this FLUKA model. Still, I hope this small contribution is helpful.
Thank you very much for running the simulation and for the careful check.
You are right: the gaps between the aluminium plates and the mica windows of detectors 3 and 6 belonged to the VOLUME region, so ¹¹C decays were also sampled there.
I attach the updated input. Besides this fix, they include:
nitrogen instead of air as the gas in the chamber, as in the reference experiment;
transport cut-offs set in all regions;
a thin plastic sheet in front of all windows. We recently learned that during the reference measurement a plastic sheet had been placed between the chamber and the detectors. Its material and thickness are still unknown, so for now it is a placeholder (50 µm polyethylene).
Unfortunately, with all this correction a huge difference between the simulation and reality still remains. If there are any more updates I will write them here.