Dear users and experts,
I am trying to emit photons with a given time distribution. The time distribution (CDF_shifted.dat,
CDF_shifted.dat (2.1 MB)
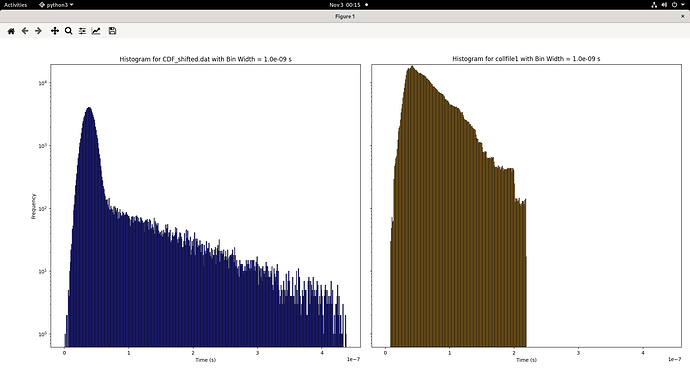
has a ~ 20 ns gaussian part and an exponential tail. It can be seen in the left side histogram of the attached image file. I sample this distribution by using " particle_age = sample_spectrum_file(“CDF_shifted.dat”,1.0D0) " code from source_newgen.f .
Now, I was hoping that if i record the time of boundary crossing of the emitted photons as they hit the detector, I should see the same distribution as it was sampled from. But I get something else. This distribution is plotted on the right side of the image file. The exponential tail is completely missing.
Is it because of statistics? Do the values mentioned in the sampling file dont have enough precision?Can someone please help me out please? the input files are attached.
thanks in advance
saurabh
SSPALS_with_CDF_data.inp (7.1 KB)
mgdraw_optical_photons.f (9.8 KB)
source_newgen_CDF.f (20.8 KB)
