)
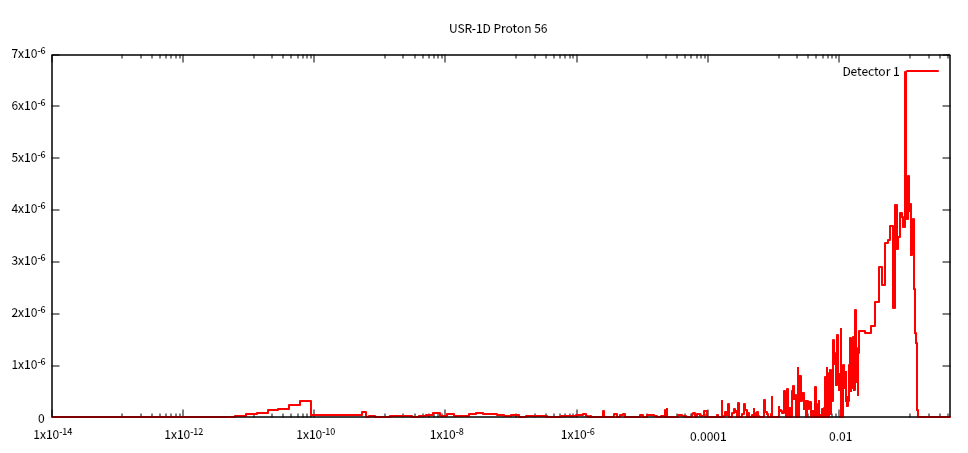
I found that the generated data (Proton_56_tab.lis) don’t correspond to the data observed by the graph(Note: abscissa and ordinate data do not match).
What is the reason for this? Hope to help answer this question.( Proton_56_tab.lis (21.3 KB) Proton_56_sum.lis (38.4 KB)
)
As first I would like to recommend you to ask only one question per thread. New questions should not be posted in the same thread where something else was already asked but in another thread. In this way, the search option within the forum will work much better.
As per your specific question…
You’re saying that the plot doesn’t match the tab.lis file that you posted. Yes, I can confirm that. It means that the plot wasn’t produced starting from those data but some other data. You must have mixed up something in your flair project.
Dear @amario
Thank you for your suggestion.After flair project debugging and running again, the data still doesn’t match.I write a new topic, In this way, the search option within the forum will work much better.