I am trying to plot my usual ratios using gnuplot as:
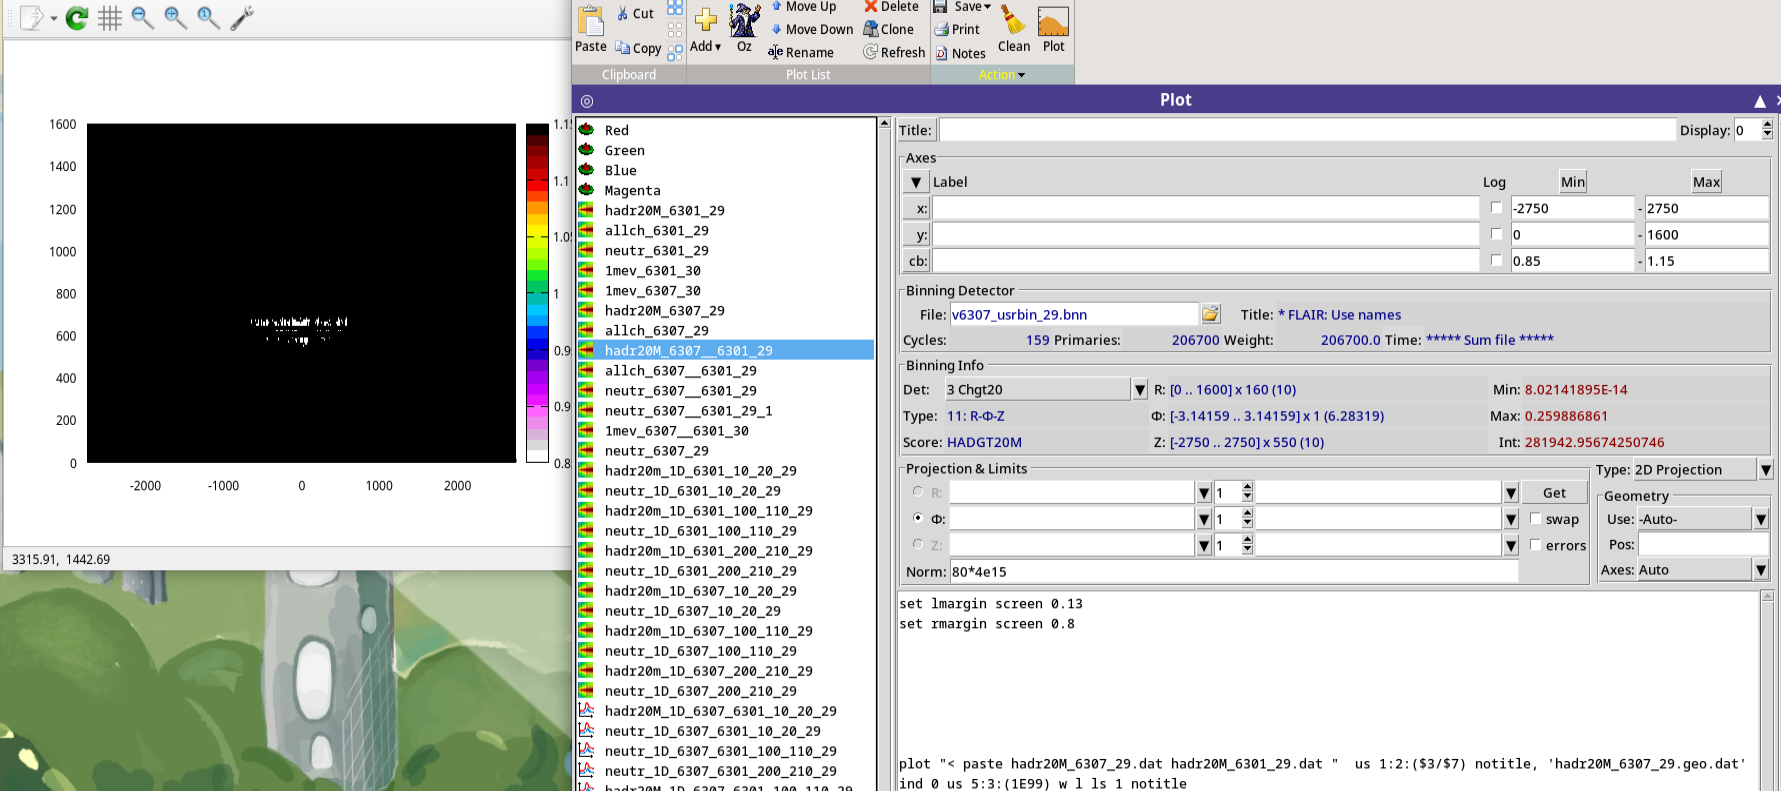
plot "< paste 1.dat 2.dat " us 1:2:($3/$7) notitle, ‘1.dat’ ind 0 us 5:3:(1E99) w l ls 1 notitle
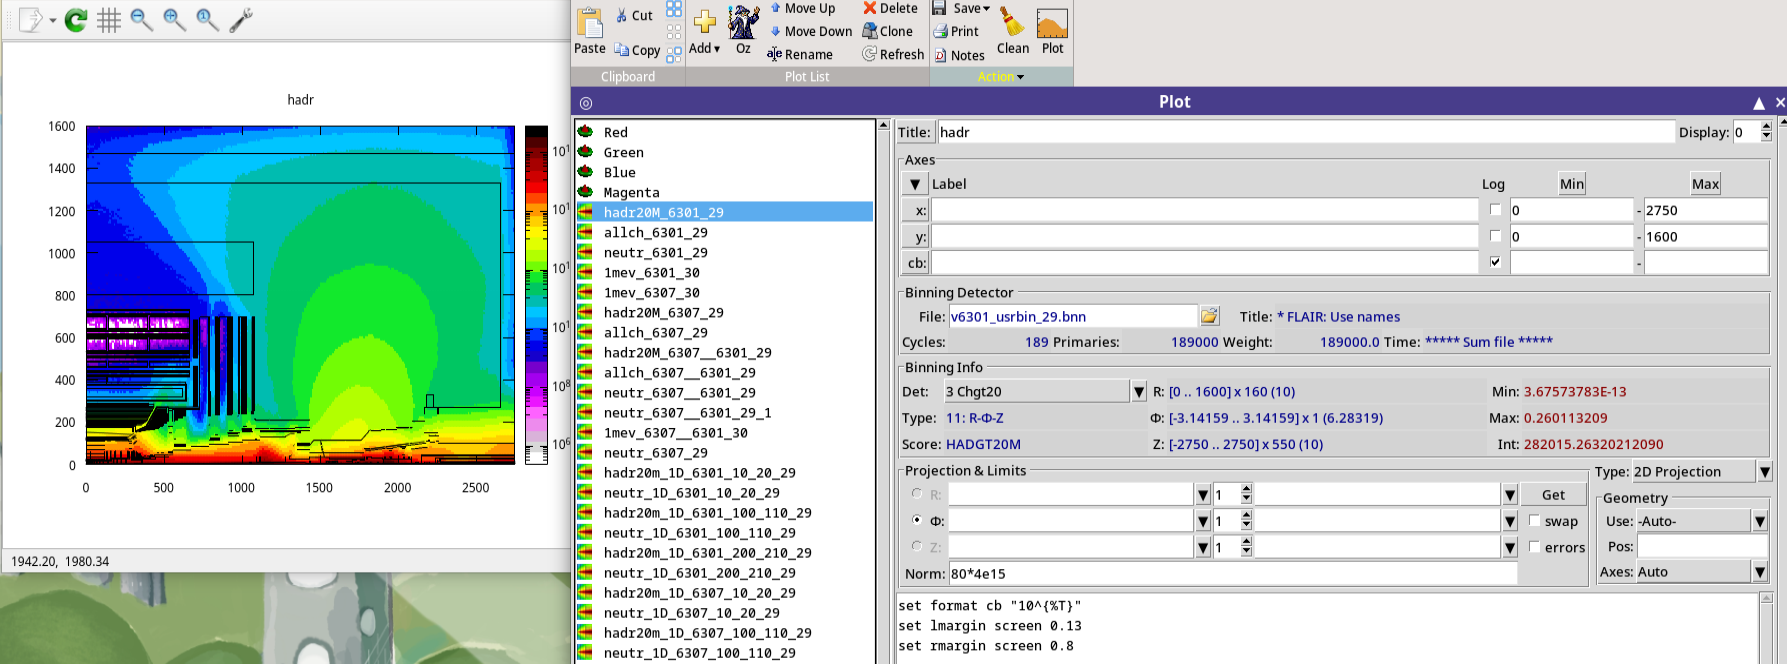
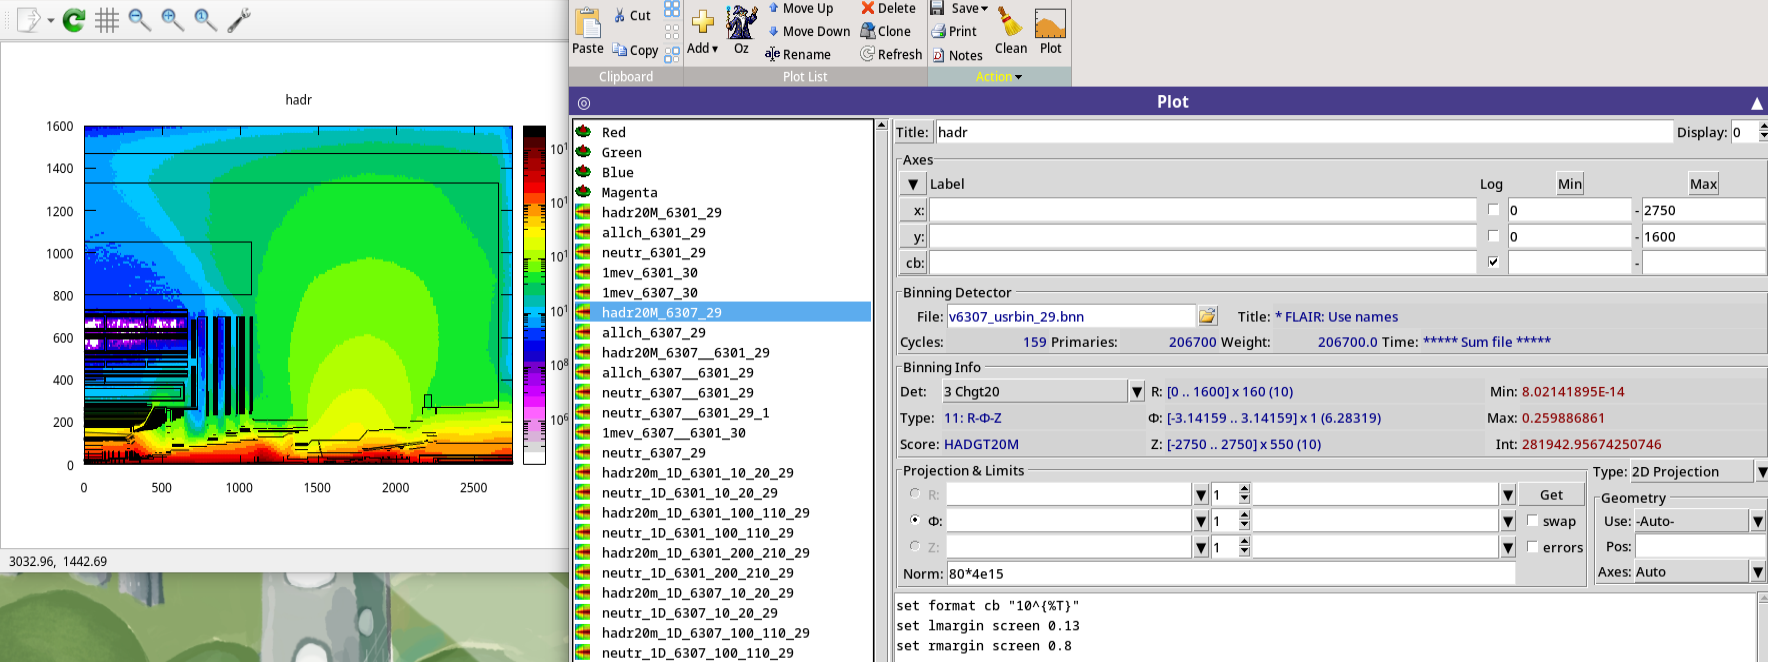
I just ran the .flair script that was already working without any changes but now trying to reproduce these results I see a weird ratio (cb scale) whereas looking at the “normal” flux functions I don’t see any troubles.
Could it be some gnuplot problem? (I had a system upgrade)
Could it be some gnuplot problem? (I had a system upgrade)
I don’t think so.
It may be that the Max you specified is too small. Try removing both values, Max and Min and check what happens.
Also, where is the 1E99 coming from? What happens to your plot if you replace it by 0.?
If the problem persists send us the output you get when creating the plot. Just after clicking on “Plot”, click on the small black window at the bottom right window of Flair. The issued gnuplot commands will be shown there, send us a screenshot. In that case, please also send us screenshots similar to those you already uploaded in your post, but with the data in the cb scale fully visible.
The Min and Max values are fine since this it’s the same CMS model but different versions of FLUKA (+ the new one has the Pointwise), so the difference should be insignificant.
I was trying to figure out about the 1E99 value but unsuccessfully, I think it was done many years ago but also I put ‘0’ instead but I don’t see any differences.
My problem was (somehow) solved just by triple flair + geoviewer update so probably some libraries ect were not installed right before that. Btw the output (small black window) was without any errors that time.