I would like to make a comparison between the 2D plots obtained through FLUKA and FluDAG. For this purpose, I have tried to use Paraview and Visit. Saying that I am new to both tools, I did not suceed in obtaining the same type of plot that is possible using Flair.
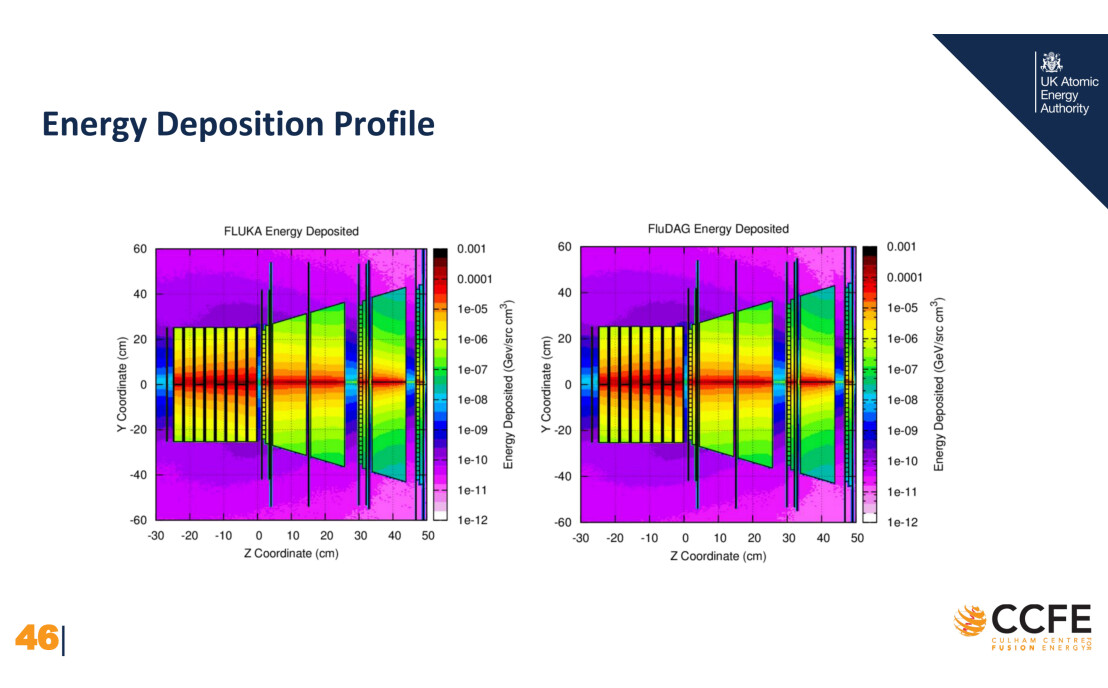
In particular, I have seen that in this slide (from a presentation), the plots from from FLUKA and FLUDAG have the same settings.
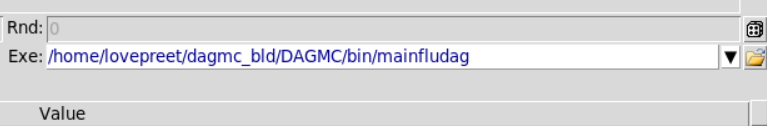
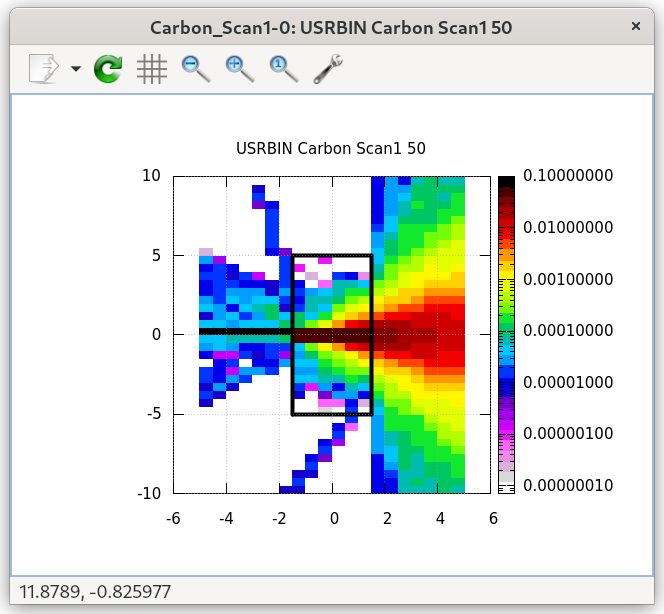
You can use the gnuplot method in Flair, you need to specify a custom executable, point to the mainfludag executable, then the gnuplot method will work as I did in the above images. It may be a little slow depending on your geomety.
My guess would be that you’ve started your plot location on a surface in the geometry possibly? Could you look at the files produced in fluka_577? It may offer some hints, dagmc might not be finding your dagmc.h5m file for example, but I’d need more diagnostic information to be sure.
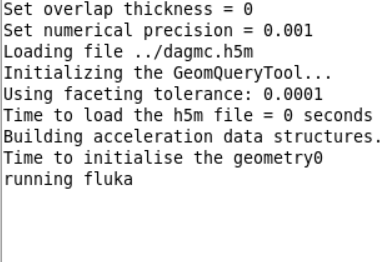
This is the content of the .log file
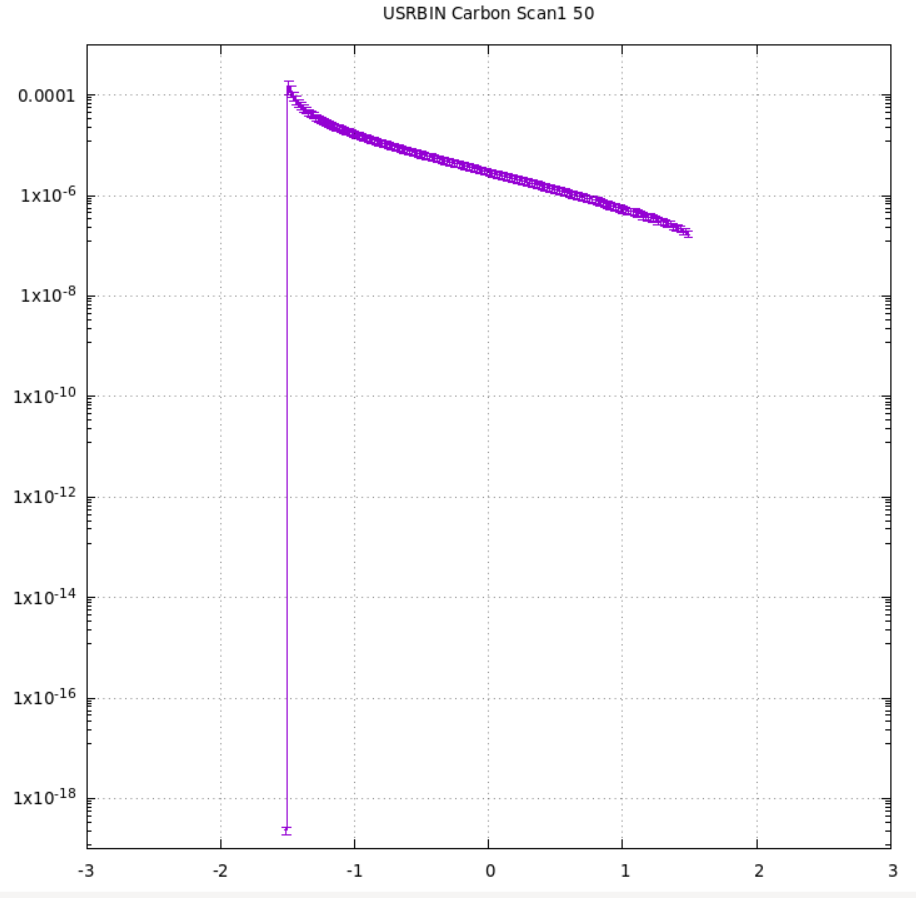
And I have tried also to plot the 1D curve in order to see if I am plotting correctly and it confirms that the deposition occurs between -1.5<z<1.5 as it should be looking at the geometry.
You’ll need to make some changes to the fluka/input.py script in the flair folder, I still havent got around to putting in a patch yet.
You’ll need to make line 2580 look like this
		#if flugg:
		#	self.close()
		#	return None

		# If VOXELS are present, write the first active one
		if "VOXELS" in self.cards:
			for card in self.cards["VOXELS"]:
				if card.notIgnore():
					self.write(card.toStr(fmt=FlukaCard.FORMAT_FREE)+"\n")
					break
		if not flugg:
			self.write(geoline[1]+"\n")		# Write title
			self._writeGeometry(FlukaCard.FORMAT_FREE, FlukaCard.FORMAT_FREE)
With all those changes, you should be running and be able to plot results
I forgot to mention, the bounds of the plot can be somewhat tricky. There is an issue when plotting FluDAG geometries when the blackhole is visible - I don’t really know why. So make sure your plot bounds are sized such that the blackhole won’t be visible. If you’re slicing the blackhole, you’ll get some error message from fluka along the lines of “medfluka region less than -33” or something like that.
If anyone from the FLUKA team has any idea why that would be, it only happens when there is too much blackhole, some is ok IIRC, but if there is a situation where a ray could traverse the blackhole and encounter another material on the otherside is when it seems to fail. Maybe @vasilis or @ceruttif could comment? It’s been an issue since we first implemented FluDAG but never got to the bottom of it.
I have solved the issue with the customized source and now it works!
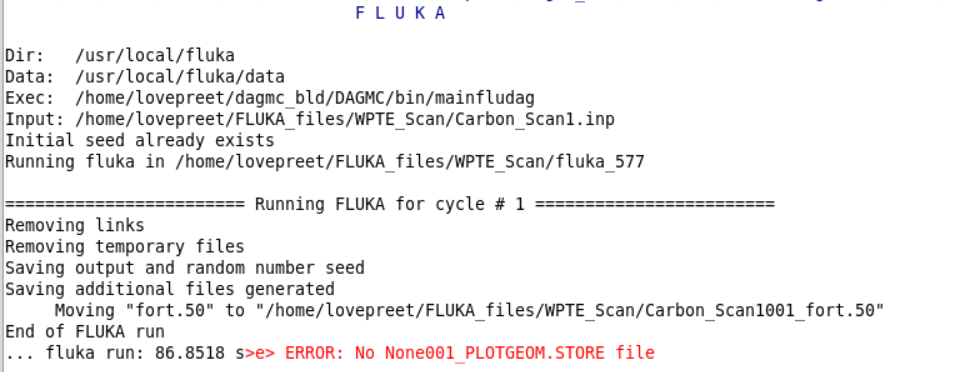
Concerning the plotting issue, I haven’t managed to solve it yet. In particular, I made the changes suggested by you. After this, I run the simulation, and the same error
fluka run: 11.5306 s>e> ERROR: No None001_PLOTGEOM.STORE file
I think the penny has dropped for me, I’ve just realised you’re using my executable as wrote (I think), which has a custom magnetic field file in there too, which expects to read a file. In the src/fluka/app/CMakeLists.txt file if you modify
Actually, I do not have any problem with the source compilation and the simulation goes well. This both with your source and mine. The problem arises when I ask flair to plot the 2D figure. It gives me the error reported above. The issue now is related only to the plotting.
Let me clear, are you using the build including my magnfld.f and associated magnfild.cpp? If you are you plot will not work, you will need to remove the magnetic files and rebuild, it is expecting to read a magnetic field file. During transport this isn’t a problem as no fields are on. So please do rebuild without the magnetic field files.
You will know if this is true by examining the log/out files from the plotting in some temporary fluka_* directory, if you see a “file not found message” then this is due to the magnetic field routine.