I am trying to produce gamma lines of equal intensity, I tried:
momentum_energy = sample_discrete_momentum_energy( [filename], [unit] ), and used a dat file for energy distribution of equal intensities.
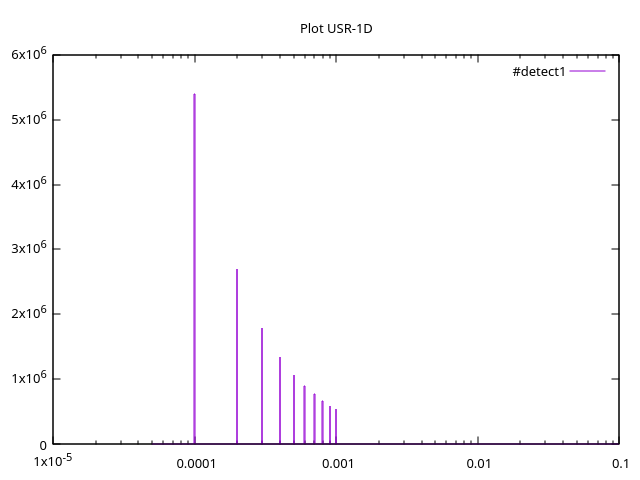
When I plot the flux using USRTRACK in the linear mode, it gives equal intensities which is fine, while in the log mode, it gives decay lines as in the pic. Is that normal? although the lines’ intensities are the same.
GAMMA2.flair (2.3 KB)
gamma_source_lines.dat (131 Bytes)
source_newgen_gamma.f (20.8 KB)