Hello there,
I just have a very simple and basic question.
For depth dose calculation, once FLUKA’s simulated the intended radiation quality, you’ll then get either 1D or 2D representation through flair GUI. Let’s take proton for example, The unit of the voxels data is GeV/g/primary protons as manual states. I’m wondering when I postprocess these 2D data in MATLAB and looking for a certain dose at the tip of the BP (let’s say 10 Gy), Do I have to normalize the data to a proton fluence (i.e. tune it up by multiplying the third column of the 2D data flair generated by number of protons *1.602E-7) that results in 10Gy at BP?
This is my approach to visualize ion beam to any prescribed dose and wondering whether it’s valid or not.
The normalization depends on your needs and on how you set up the problem, and of course on the quantity you are scoring.
Indeed, for DOSE, the output is in GeV/g/primary, which you can scale up by your desired proton fluence to obtain Gev/g and multiply by the conversion factor 1.6021766208e-7 to convert from Gev/g to mJ/g=Gy.
Note that you can apply normalization factors directly in FLAIR when plotting (i.e. no need for postprocessing in MATLAB unless you want to).
I am not sure what you mean when you say you are looking for a certain dose at the tip of the BP(=Bragg peak?). Providing a working example of your input file also helps to understand better your question.
Thank you Daniel for your explanation.
Sure I’m aware of the normalization field embodied in FLAIR, however the normalization factor differs for both 1D and 2D projections.
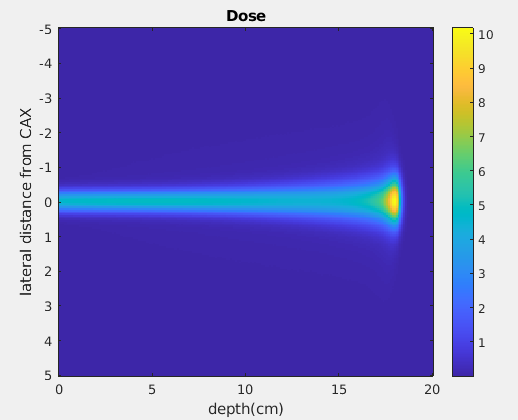
Generally, the reason I use a MATLAB is that I’m scoring other quantities such as dose weighted LET and RBE using USRBIN thus I need matlab code that loads and converts the 2D projection plot.dat in to 2D array to visualize the spatial distribution of both dose averaged LET and RBE. The purpose is examine some clinical dose prescriptions and their relative effectiveness.
What I usually do and please correct me if I do it wrongly,
ZX_voxel dose = the third column converted to 2D matrix.
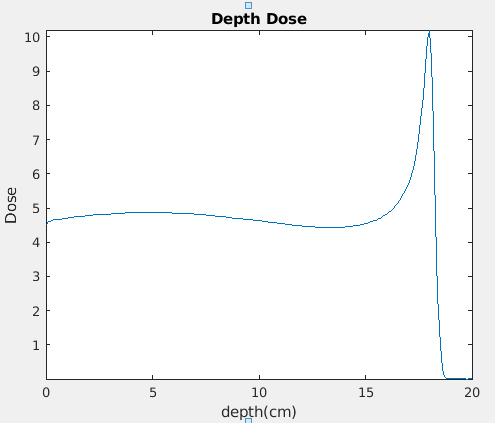
from there I normalize the dose by scale the number of proton time conversion factor:
Dose = ZX_voxel dose * 2.9e10 proton * 1.6021766208e-7
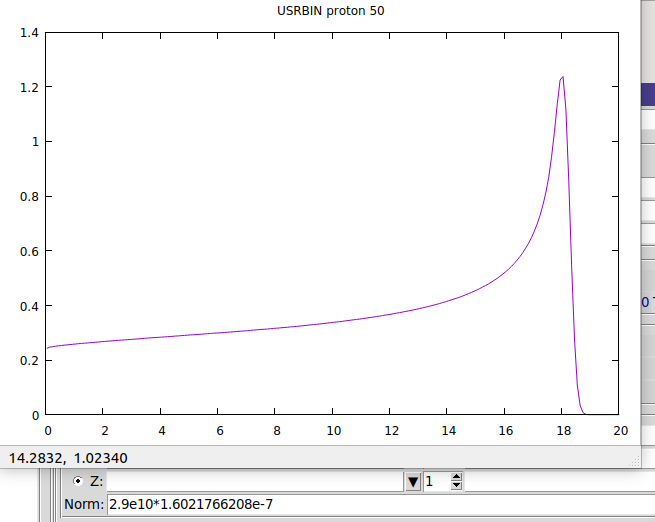
Also using the same conversion factor, when I plot the dose as a function in depth along central axis in matlab is not the same as 1D projection in flair.
The 1D projection in flair is the dose average over the 2D scoring plane corresponding to each depth coordinate. To get the dose value along the central axis, you need to properly set the X/Y limits in the Flair plotting tab (or plot the 1D Max profile, which takes the maximum dose value in the aforementioned plane, normally corresponding to the central axis bin value).