Python colormap to reproduce "visually" FLAIR 2D histograms

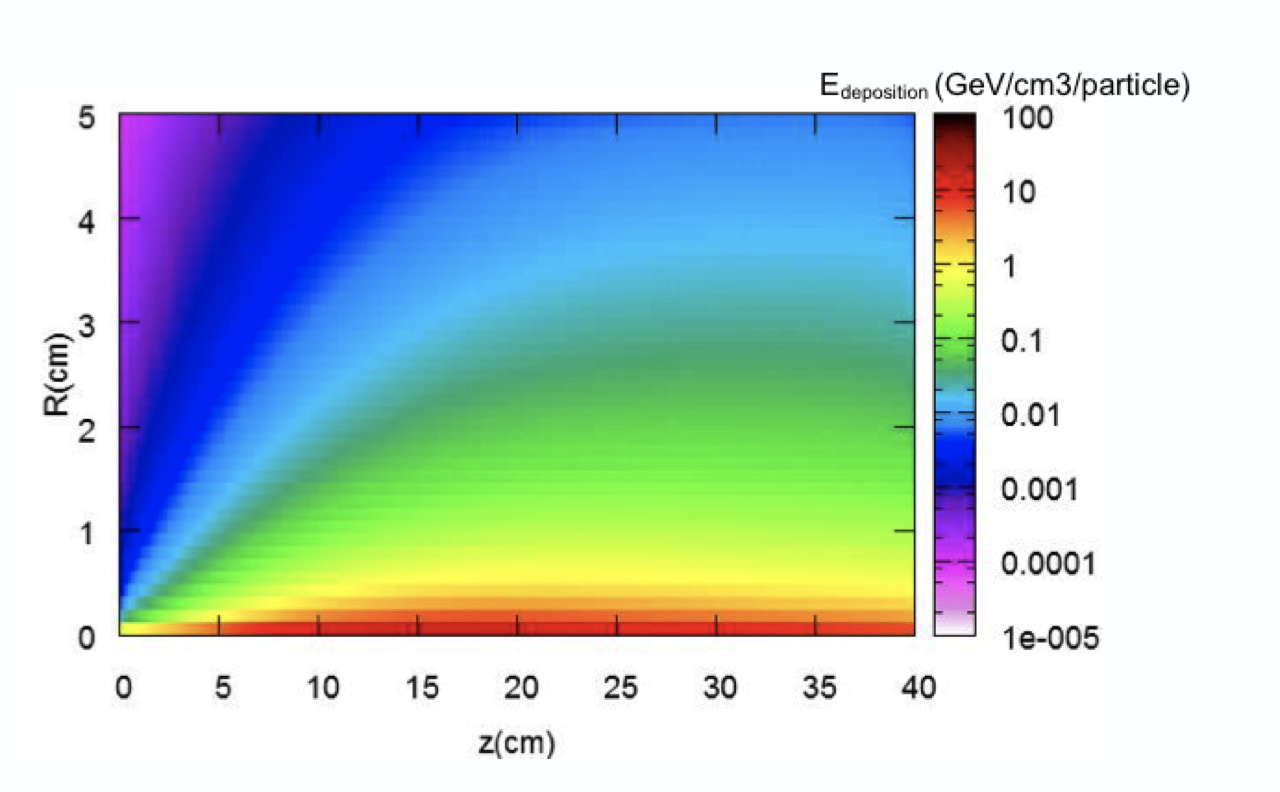
I am comparing home-made simulations with Geant4 with existing FLUKA simulations for which I have 2D histograms. Although I am not a big fan of the colormap that is being used (e.g. it is not perceptually uniform) this is useful for quick debuging / visual comparisons.

Do you know if someone has a Python script, trick or suggestion to reproduce the colormap exactly?

Thanks in advance!

Hi @chernals
I don’t understand what do you mean by perceptually uniform?
In any case all palettes are controlled with the Palette.py of flair and
what is given to gnuplot can be overridden by the user by issuing the gnuplot command

set palette ......

inside the gnuplot commands of flair plots.

Dear Cedric,

I use the following python code to create the FLUKA colormap for matplotlib:

flukacolors = [(1.0, 1.0, 1.0), (0.9, 0.6, 0.9), (1.0, 0.4, 1.0), (0.9, 0.0, 1.0), (0.7, 0.0, 1.0), (0.5, 0.0, 0.8), (0.0, 0.0, 0.8),
               (0.0, 0.0, 1.0), (0.0, 0.6, 1.0), (0.0, 0.8, 1.0), (0.0, 0.7, 0.5), (0.0, 0.9, 0.2), (0.5, 1.0, 0.0), (0.8, 1.0, 0.0),
               (1.0, 1.0, 0.0), (1.0, 0.8, 0.0), (1.0, 0.5, 0.0), (1.0, 0.0, 0.0), (0.8, 0.0, 0.0), (0.6, 0.0, 0.0), (0.0, 0.0, 0.0)]
cmap_name = 'fluka'
cm = colors.LinearSegmentedColormap.from_list(cmap_name, flukacolors, N=300)

And and example, how to use it in a 2D plot:

plt.imshow(..., cmap=cm, ...)

Cheers,
David

1 Like

@vasilis Thanks for your quick reply. See for example this: https://www.kennethmoreland.com/color-advice/BadColorMaps.pdf

this is a more a quirk of mine though…

I was looking at palette.py and was getting there but @horvathd reply was faster. This is exactly what I wanted.

Thanks both!