Versions
Please provide the used software versions.
FLUKA:4-5.1
Flair:3.4-4
Operating system:
Description
Please describe the issue. In case of reporting a bug, please provide step-by-step instructions for reproducing the error
Dear FLUKA experts,
I hope this message finds you well.
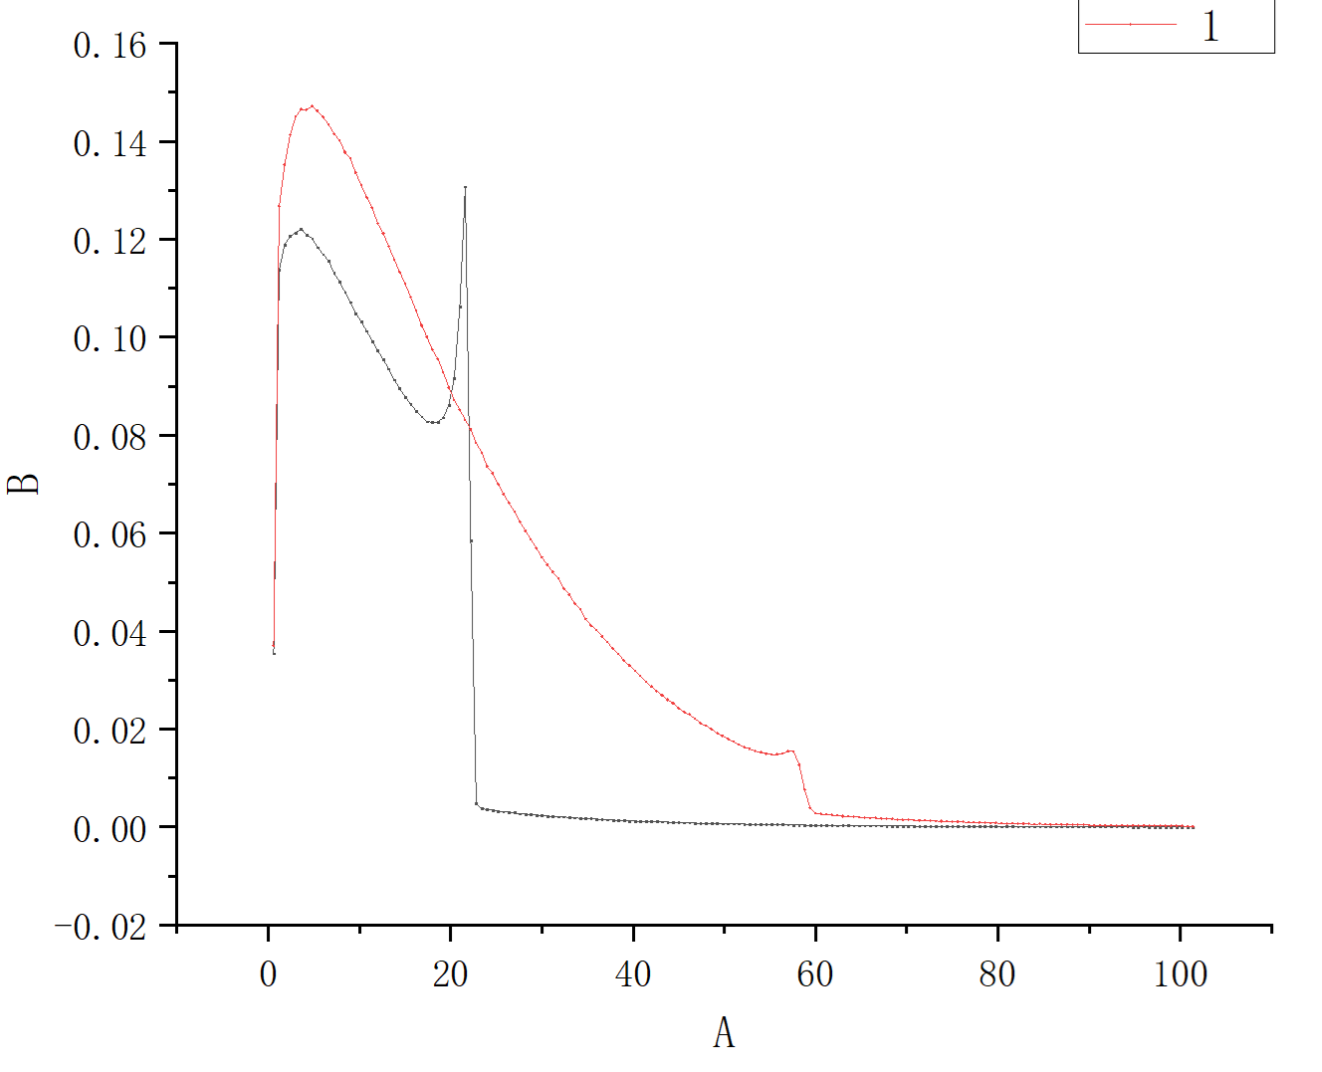
I am simulating energy deposition from protons in a cylindrical Lead-Bismuth Eutectic (LBE) target (radius = 32.5 cm, height = 100 cm) for incident proton energies ranging from 0.5 GeV to 4.0 GeV .
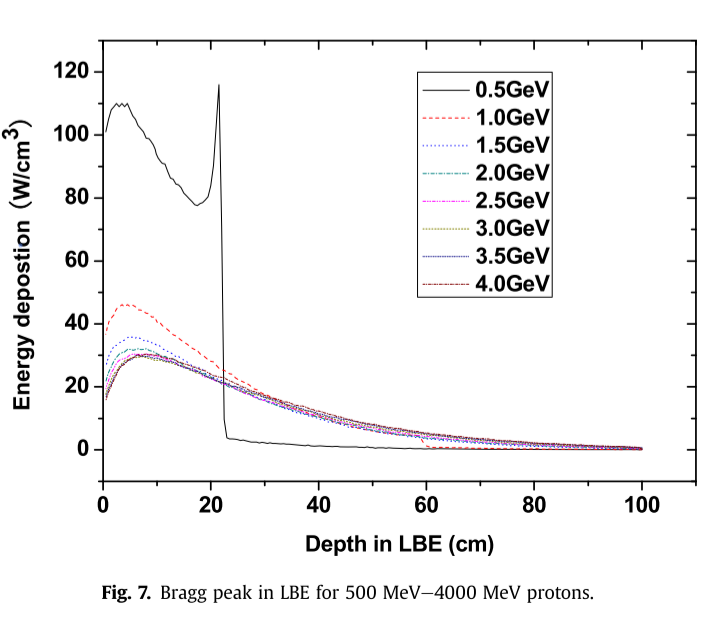
In my simulation results, I observe that the energy deposition at 1 GeV is higher than at 0.5 GeV . However, some literature (e.g., Fig. 7 in the attached reference) suggests the opposite trend — that energy deposition at 1 GeV can be lower than at 0.5 GeV in LBE.
I’m trying to understand the reason for this discrepancy. Could it be due to:
- Differences in the physics models activated (e.g., PEANUT vs. DPMJET, coalescence, pre-equilibrium models)?
- The definition of “energy deposition” (e.g., total deposited vs. locally deposited energy, or inclusion/exclusion of escaping particles)?
- Target size effects (my target is thick enough to stop lower-energy protons but not higher ones, which might affect lateral leakage and energy containment)?
- Differences in cutoffs (e.g., transport thresholds for electrons, photons, or neutrons)?
I’ve attached:
- A screenshot of my simulation geometry (cylindrical LBE target).
- A reference figure (Fig. 7 from literature) showing the Bragg peak curves for 0.5–4.0 GeV protons in LBE.
I’d greatly appreciate any insight into what might cause this trend reversal, and whether my setup might be missing a key physical process or simulation setting.
Thank you very much for your time and help
Input files
Please upload all relevant files. (FLUKA input file, Flair project file, user routines, and data files)