Dear all,
We are trying to obtain the LET, Fluence and Absorbed Dose for an experiment that we would like to perform at our facility.
The layout of the geometry and physics behind the experiment should be as follows:
-
we have a proton beam, with energies ranging from 10 MeV to 18 MeV in steps of 1 MeV
-
the beam hits a Gold foil (6.7 um) in order to be spread
-
from vacuum we transport the beam in air through a Si3N4 membrane (15x15mm 500nm thickness)
-
at the end of the membrane we have our well cells which are made of polystyrene (diam 34 mm thickness 1.32 mm). for the cells we have used 10 um of water.
I have several questions regarding my simulation and I would very much appreciate any help I can get:
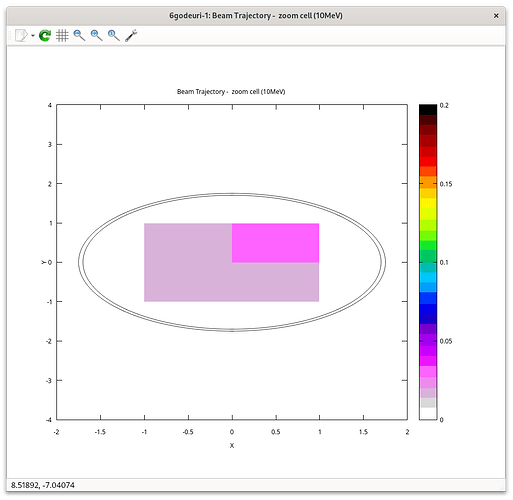
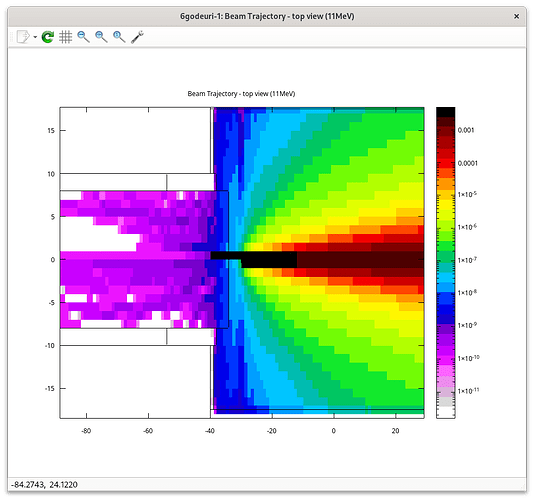
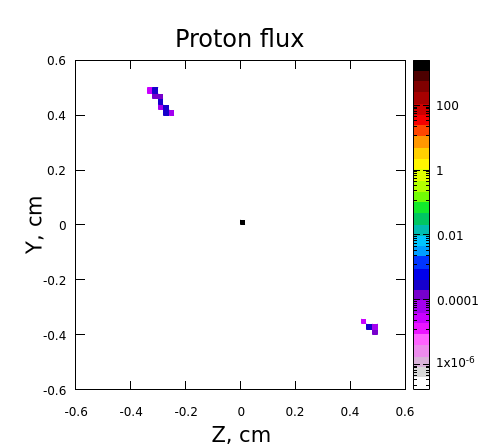
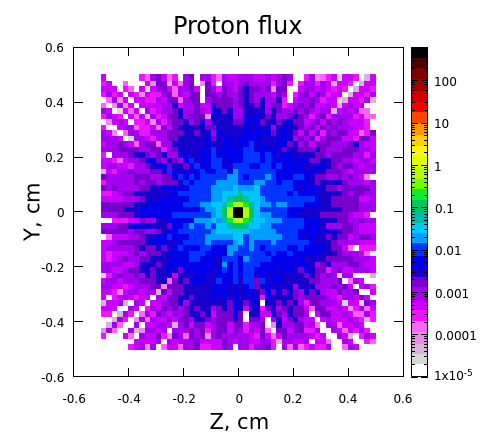
- For seeing the spreading of the initial beam after hitting the Au foil I have used the USRBIN card with BEAMPART but the results seem rather weird and I don’t quite understand why when the beam is hitting the cells we do not see it uniformly distributed:
I checked and rechecked everything and I must really miss something… As you can see below the spot of the beam is not uniformly distributed.
I am also attaching a screenshot for where the beam hits the Au foil as I think there lies the problem.
But checking the geometry(on all planes) I do not seem to get a hold of what I am doing wrong
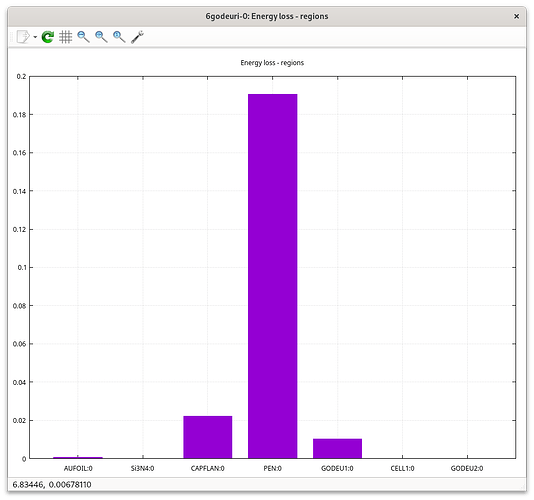
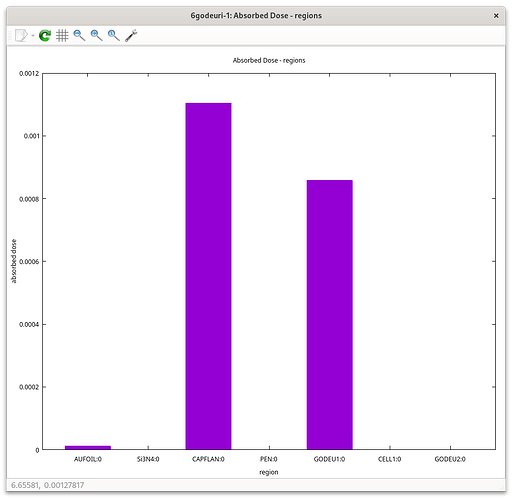
- For the Absorbed Dose and Energy Loss I used the USRBIN card with REGION selecting the regions of interest. Is there any way of writing on the plot done with flair what is the aborbed dose in each region and how much energy was lost in each region? Or this can only be done with another software?
- As I was saying in the beginning of my post we are interested in several energies so we would like to plot on the same picture the LET and FLUENCE for all energies rather than having 9 separate plots. Could this be achieved via flair?
I am attaching my input and flair project bellow.
6godeuri.flair (12.3 KB)
6godeuri.inp (9.0 KB)
All results are not yet normalized and this is only to check but in order to take into account the beam intensity we should multiply all results by the actual intensity of the beam?
Thank you in advance!
Best,
Irina
