I’m trying to model a brachytherapy shielding, calculate effective dose rates and compare them to calculations based on IAEA SRS 47 and similar results I got from PHITS simulations.
The source of radiation should be an Ir-192 with activity of 555 GBq.
I defined a simplified version of geometry built of a concrete wall and air around. I tried to estimate effective dose rate in mesh-volume and got results many orders smaller than PHITS and theoretical calculations yielded. I used EDWORST conversion coefficient, since it’s recommended as the best option (slide #9) for shielding calculations and DOSE-EQ option in USRBIN card. RADDECAY and DCYSCORE are set to use semi-analogue mode. Basically, I do not have to consider time and decays of Ir-192 nuclei, all I need is to calculate effective dose rates in an assumption that the source of 555 GBq activity was just placed in the brachytherapy room and I’m measuring the dose quantity with a dosimeter for several seconds.
I suspect from physical reasons and know it from daily routine, working with sources like F-18, that doses should be different for different activities, because greater activity leads to greater intensity of radiation due to greater number of decays per second.
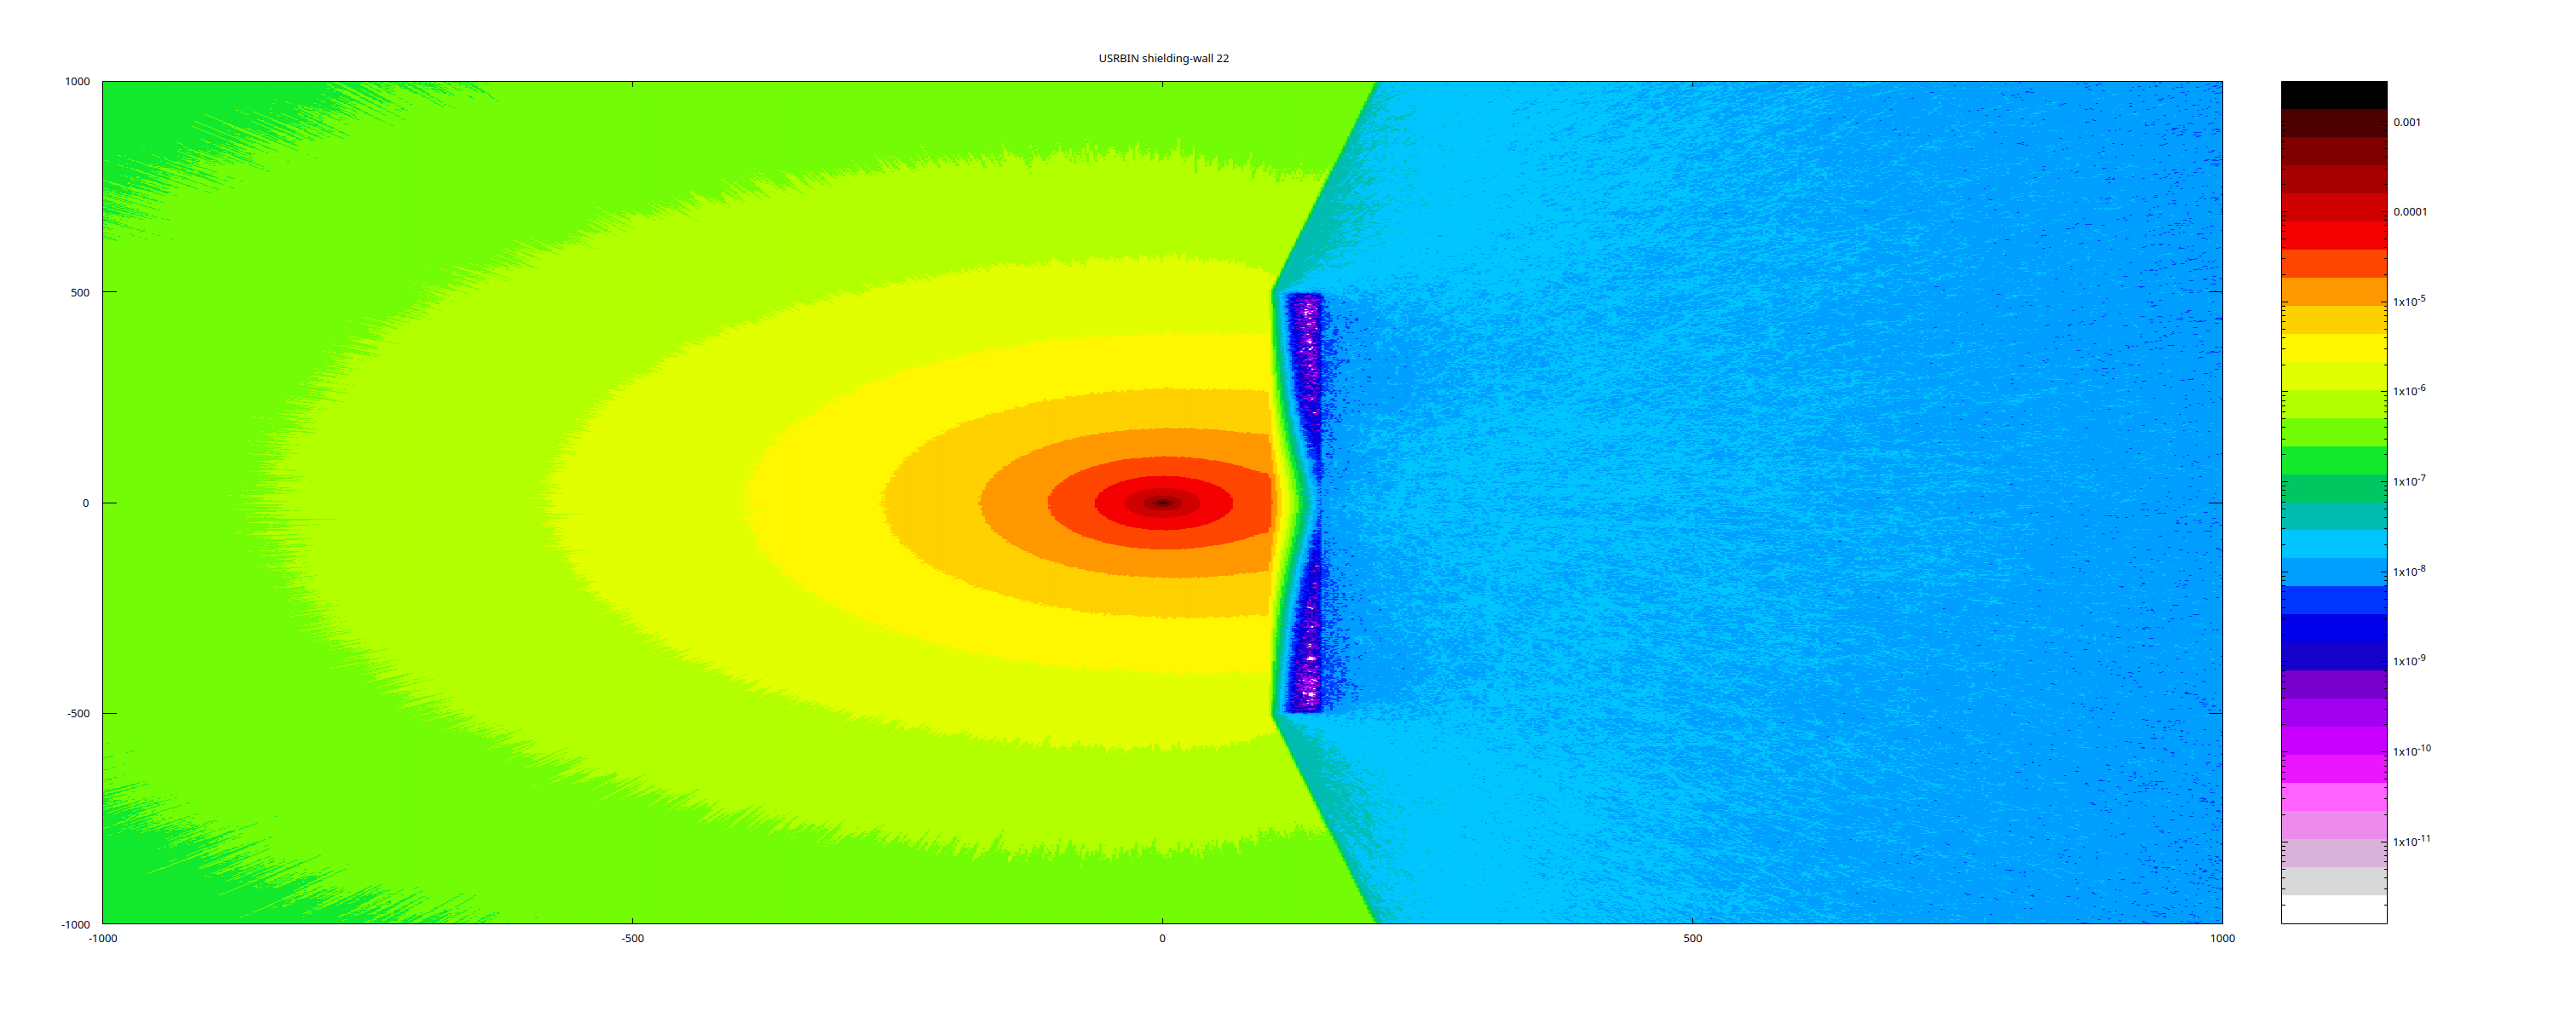
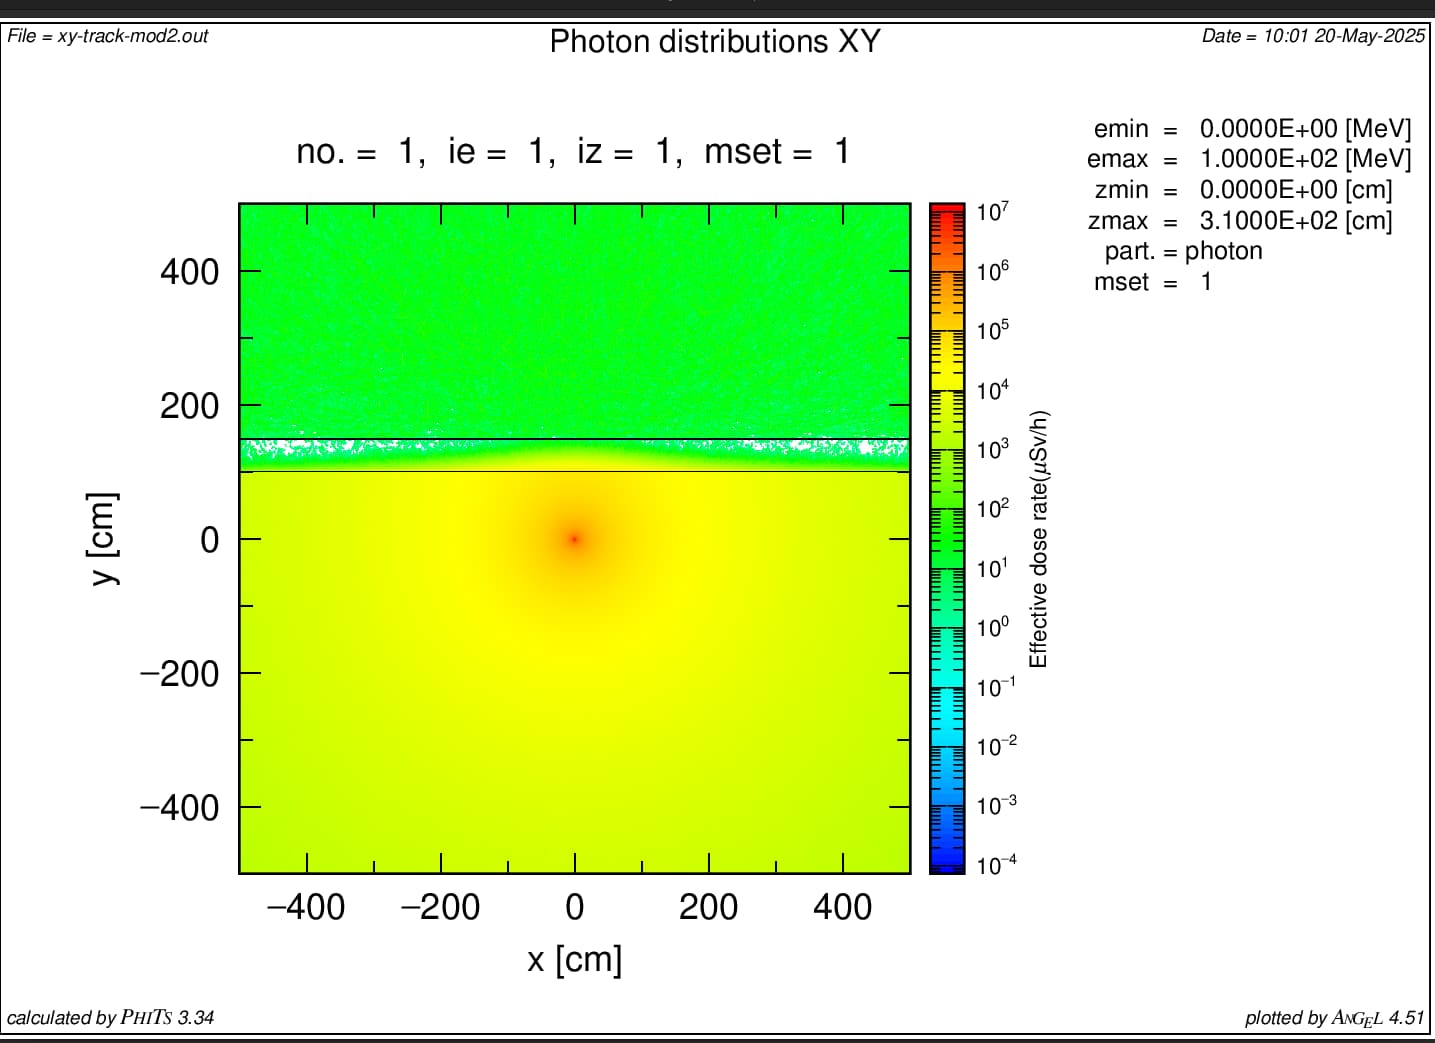
How can I consider 555 GBq of Ir-192 in my simulations? And what causes such big discrepancy in FLUKA and PHITS results (you can compare orders of dose rates on the plots below)? What am I doing wrong?
It looks like your maximum PHITS doserate is on the order of ~10^7 uSv/hr, and that the one in the FLAIR graph is ~0.001 (not sure what the units are here, since you didn’t mark them). This is indeed a big discrepancy, but it leads me to believe that you may have neglected to account for the normalization (and maybe unit conversion?).
When using a radioactive source, the DOSE-EQ USRBIN will give the dose in pSv PER primary. In the case of a semi-analogue run like this, the ``primary’’ that the result is normalized by is a disintegration of the radioisotope.
So… from that last comment you might already have thought of my suggestion—you need to multiply your results by the activity (555 GBq) for the results to match. Did you already do that?
From my estimate, 0.001 pSv / disintegration → ~2.0e6 uSv/hr, which definitely brings the results closer in agreement. Also be careful about your averaging window for FLAIR plots, by default the projected dimension will be averaged over all bins which can create the illusion of a lower dose for compact sources.
Let me know if you already did that, or if this fixed the problem!
Dear Ihor,
I just checked your .flair file. Certainley the cause of descrepensy you observe is the normalization factor for the plot. The input file it self is correct and there is no need to set activity of the used isotope. The output of the dose scoring (DOSE-EQ) is pS/primary. The primary particle, or more correct “event” for the isopoe source is a singe decay, so you need t oset activity or total number of decays per evaluated time.
One additional tip, is to set the region, of a spherical volume of the iridium, overlaping your source and corresponding it physical dimension, and so to include self shielding effect. It will significantly change the source spectrum, an so will simulate selected material more exactly, demonstaring difference in use of various isotopes.