I am scoring Dose-Eq. at the top surface and at 1m from the top surface for the attached geometry.
I have noted the following pattern:
Surface:
At x = 7 to 11cm, there is a sudden increase in error and also in dose-eq values.
Similarly there is an increase in error and values from x = -7 to -11. But, there is also a difference when we compare values at x=-10 and x=+10 . Why is it so as the geometry and source are symmetric?
At 1m:
At x= 24.5 to 31.5 cm, there is a sudden increase in error and dose-eq value but it is not so at x = -24.5 to 31.5cm. I don’t understand the reason for this ? Is it due to some error in geometry or biasing used?
Please find attached the required files, with one pdf in which I have done the analysis.
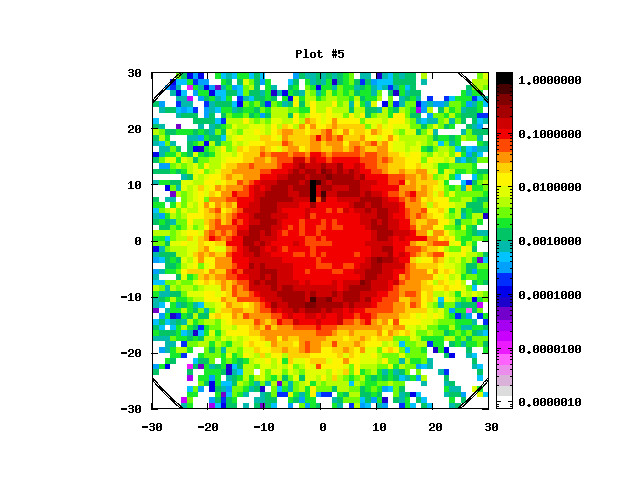
The asymmetry that you notice is due to the lack of statistics. I run your input with 50 millions primaries and added a larger USRBIN scoring for dose equivalent at z=50 where your zone of interest is.
As you can see from the first picture the dose equivalent has cylindrical symmetry, the lack of smoothness is due to the lack of statistics. If you do the plot at lower z, you will have a very smooth plot with nice “iso-dose” curves.
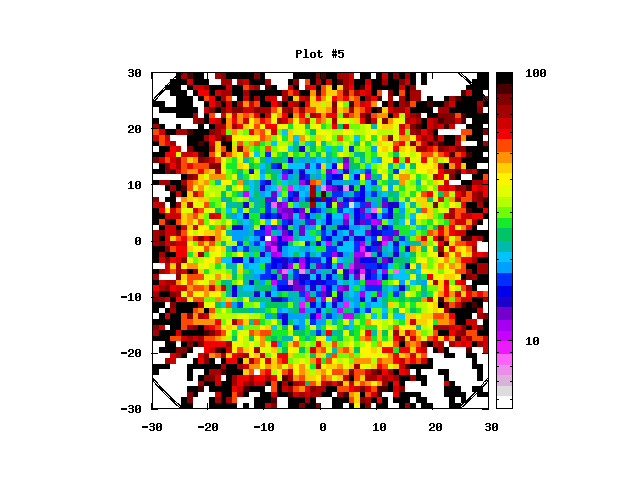
The second picture shows the uncertainty on the estimated value of the dose equivalent. You can see that it “fluctuates with a radial symmetry”
Therefore, you simply need to run with increased statistics.
Additionally, I would suggest two things. First, you to check your results not just by looking at the text file but also looking at the plot of the results and second, to use usrbin not limited to just one 1 bin in two out of three coordinates.
Thank you for the guidance. I increased the primaries and got good results.
I have done another analysis as follows and have a question to ask:
In the same geometry, we simulated dose eq. at the surface of the top, i.e., z=50.5 to 51.5 using the x-y-z bin (inputs attached with each case). Case 1: The whole geometry was filled with air:
The 12 source cylinders were filled with air input1.inp (4.0 KB)
The 12 source cylinders were filled with cobalt input2.inp (4.0 KB)
*The source RCCs (bodies) were absent. input3.inp (4.0 KB)
Case 2: The whole geometry was taken as such (with lead, SS filled at their places):
The 12 source cylinders were filled with air input4.inp (16.4 KB)
The 12 source cylinders were filled with cobalt input5.inp (16.8 KB)
Case 3: Instead of whole geometry, a single cylinder (representing the whole geometry) was drawn and filled with air. Inside this cylinder, 12 source cylinders were made.
The 12 source cylinders were filled with air input6.inp (4.3 KB)
The 12 source cylinders were filled with cobalt input7.inp (4.3 KB)
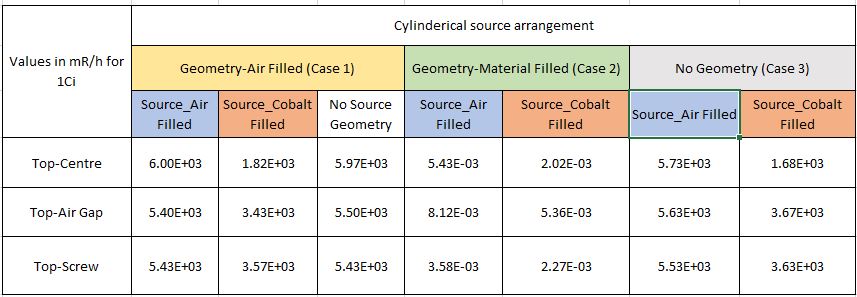
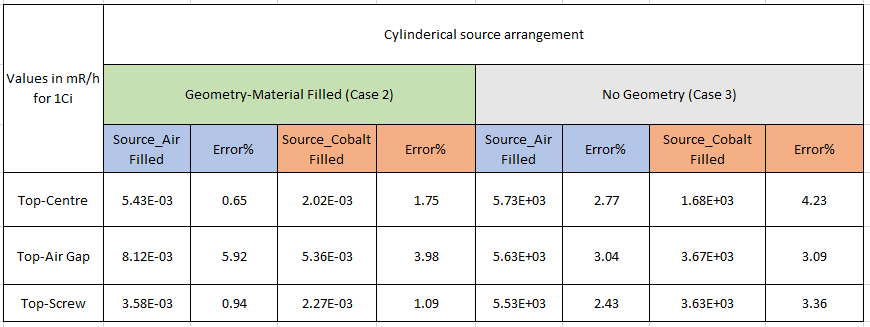
The results are tabulated in the attached image. Cenre bin: x = -0.5 to 0.5cm, air gap bin: x= 9.5 to 10.5cm, and screw bin: x = 14.5 to 15.5cm
I observed the following:
a. At centre, the values when source cylinders are air filled are approx. 3 times higher than the scenario in which source cylinders are filled with cobalt.
b. At air gap and SS screw, the values when source cylinders are air filled are approx. 1.5 times higher than the scenario in which source cylinders are filled with cobalt.
c. There is no significance difference in results because of a greater number of regions in the geometry (regions filled with air).
I understand that the cobalt filled source cylinders shall provide some attenuation. But is this the only reason for 3 times or 1.5 times higher values for air-filled source cylinders case.
Also, it confuses me that - why then 3 times and 1.5 times - it should be a uniform ratio.
Can you please throw some light on this ?
Dear @jyoti.grg,
To do such comparison it would also be good to know what are the uncertainties on these numbers as these could be also quite large.
At first sight, I would say that the Cobalt filled source cylinders provide, as you say some self-shielding. This is more evident at the “top-centre” because of the angles between the cylinders and the point. The “top” points are larger radius can more easily receive contribution from the lower-z part of source cylinders.
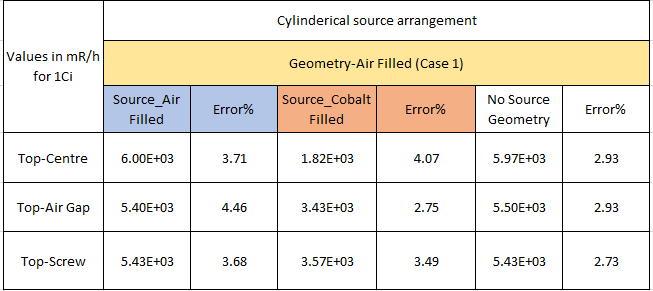
PFA the associated errors with the values obtained.
I agree with the angle-dependent self-shielding. Thank you for the explanation.
I still want to understand: For the case - Geometry Air-filled - (i.e., there is no high Z material in the geometry) -
Dose rate at Top air gap point is less than the dose rate at Top centre for Source Air-filled case,
while it is higher for Source filled with cobalt. What is the reason for this ?
When the source is filled with Cobalt, the Cobalt itself shield the radiation. Because of the geometry of the system (if you want, the angle by which the two points see the rods) the shielding effect if larger in the center rather than at the larger radii of the gap and the screw.
The opposite instead holds true when the whole geometry is made of air. The center point is closer to the rods than the other two.