Dear @jyoti.grg,
The asymmetry that you notice is due to the lack of statistics. I run your input with 50 millions primaries and added a larger USRBIN scoring for dose equivalent at z=50 where your zone of interest is.
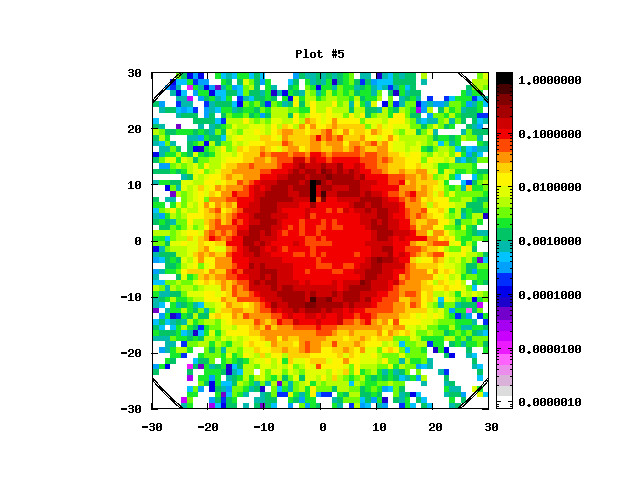
As you can see from the first picture the dose equivalent has cylindrical symmetry, the lack of smoothness is due to the lack of statistics. If you do the plot at lower z, you will have a very smooth plot with nice “iso-dose” curves.
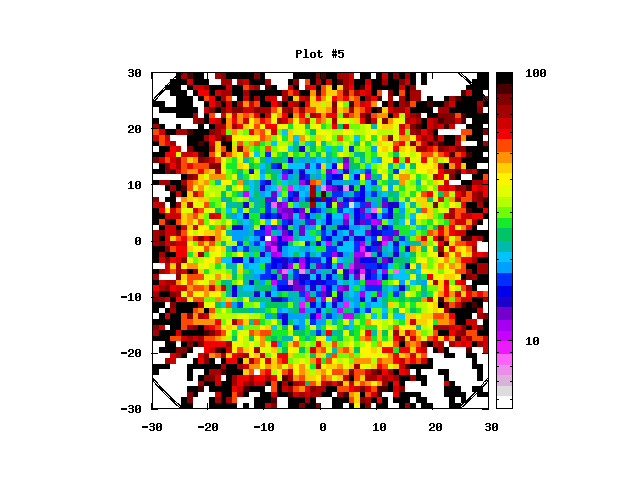
The second picture shows the uncertainty on the estimated value of the dose equivalent. You can see that it “fluctuates with a radial symmetry”
Therefore, you simply need to run with increased statistics.
Additionally, I would suggest two things. First, you to check your results not just by looking at the text file but also looking at the plot of the results and second, to use usrbin not limited to just one 1 bin in two out of three coordinates.