Dear fluka experts,
I’m getting some results that I’m having a hard time interpreting. Can you help me?
My input consists of a beam of protons hitting a cell. My first deadlock is related to the USRBDX [1] detector, it doesn’t produce any results and the files appear empty.
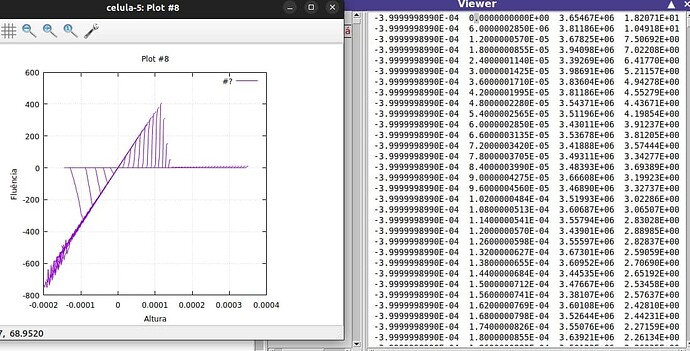
And second, about a plot type of .dat file generated from a USRBIN card that I tried to plot on the USR-1D tab, but I can’t understand the graph and results and I’m wondering if they mean anything at all… . [2]
I would also like to know if I can use the PART-THRES [3] card for this type of input, what could be wrong?
And ALSO, sorry for all the questions, I would like to know if I could use the BIASING or LAM-BIAS cards to increase the rate in the cell that secondary particle production events occur, when I use USRBIN detectors to look for secondary particles, nothing is produced. What do you think could be wrong?
Attached files follow.
Thank you very much in advance!!
celula.flair (6.0 KB)
celula.inp (3.9 KB)
celula_01.inp (4.1 KB)
celula_01.out (869 Bytes)
