Hello dear expert;
please someone help me by giving me the procedure to follow to obtain the results of a simulation in this form?
Cordially
What do you mean by “in this form”?
here are the results that I obtained by running this simulation so the input file is attached how to present my result there in the previous form that I sent
Uploading: carbone400.inp…
Uploading: dose.png…
here are the results that I obtained by running this simulation so the input file is attached how to present my result there in the previous form that I sent
here are the results that I obtained by running this simulation so the input file is attached how to present my result there in the previous form that I sent
how to present my result there in the previous form that I sent
here is my input file
carbone400.inp (3.8 KB)
Dear @bakodeo,
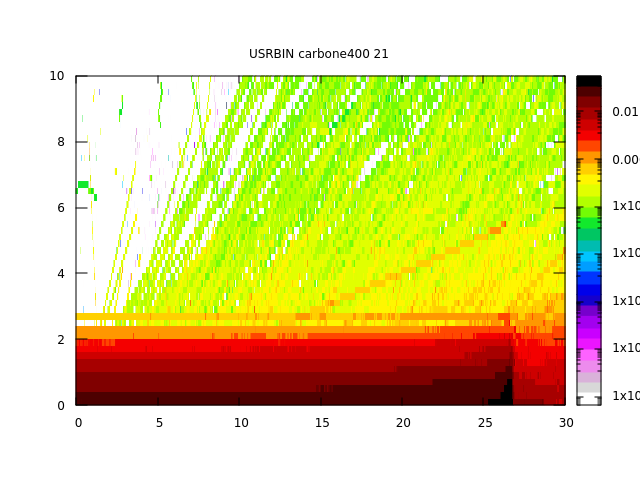
This plot:
has been obtained plotting the results in the “Plot” tab in flair via gnuplot.
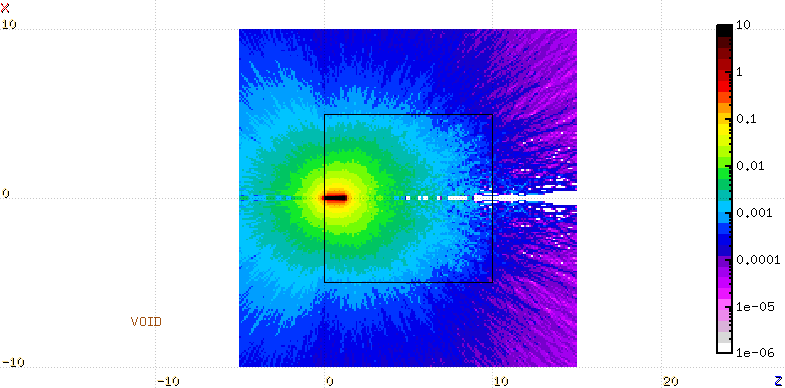
Instead, this plot:
has been obtained superimposing the results on the geometry in the “Geometry” tab in flair.
To see how to plot your results in the “Geometry” tab in flair, have a look at the flair introduction lecture from the last Fluka course, specifically, slides 59-63.
@amario
Thank you so much