I am new to FLUKA and I am trying to simulate a runaway electron beam impacting a tungsten target.
These simulations aim to study the energy deposition in the material while varying several input parameters, such as the magnetic field intensity (B), the beam energy (E), the magnetic field angle with respect to the target surface (γ_B), and the beam incidence angle on the target (γ_e).
REs impact the plane X-Y (x is the poloidal coordinate and y the toroidale one).
The questions I have are:
How can I correctly represent the angles involved in the problem in FLUKA?
At the moment, I am setting γ_e by defining an appropriate BEAMPOS, while γ_B is specified by selecting the corresponding components of the magnetic field.
Is this approach correct?
I am scoring the energy deposition and electron fluence using USRBIN.
I am also interested in tracking the events of individual electrons. I am currently using USERDUMP to visualize them graphically, but I would like to generate an output file containing detailed information such as collision events, energy losses, trajectories, boundary crossings, etc.
How can I modify the file mgdraw.f to achieve this?
Am I correctly simulating a monochromatic beam (E = 16.5 MeV) by using the following card?
Your approach is correct. Another alternative is also BEAMAXES; your choice.
Regarding the individual electrons, could you be more descriptive/detailed regarding your needs? e.g. if you want to score the energy loss of an electron, you would practically have an entry for each step length of the simulation, which can easily lead to files that explode in size.
Yes, your card correctly simulates an electron with kinetic energy of 16.5 MeV.
The FLUKA simulation is normalized per primary - meaning, you simulate N independent electrons, but the default scoring outputs (e.g. USRBIN) give you a statistical average normalized to 1 primary electron.
Feel free to also upload your inp file should you need further assistance.
Regarding the use of mgdraw.f, I understand that it allows me to obtain the track of an electron between two interactions. I would like to verify this only for a small number of primaries by having a formatted file.
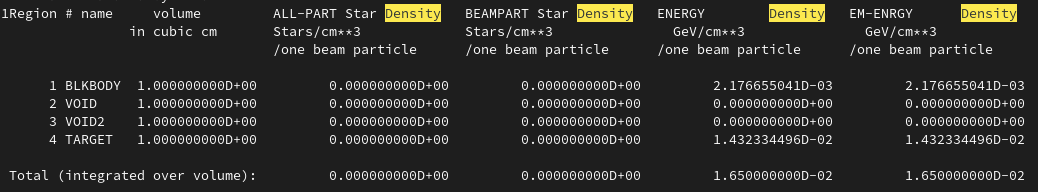
I have another question about the energy deposition. If I take the 1D projection of the energy deposition along z and multiply it by the transverse scoring area (A_bin_tot = dx × dy × Nx × Ny, where dx and dy are the bin dimensions along the x and y directions, and Nx, Ny are the number of bins in each direction), I obtain the linear energy deposition in units of MeV/cm/primary.
If I integrate this curve over the whole domain, do I obtain the total energy deposited in the target (MeV/primary)?
Is this value equivalent to the “Energy” reported in the “Events by region” section of the ******001.out file?
A priori, you would not even have to adjust an mgdraw routine, and you could even do it in flair; e.g. slide 13 of this presentation.
If you take a 1D projection, your values will be averaged over the area. In principle, you could indeed reverse engineer this by multiplying with the number of bins and the bin widths. Integrating this courve would indeed yield the total energy deposited.
I am not sure I follow which section in the out file. Could you upload here your file?
I saw the presentation you mentioned. I would like to know if it is possible to obtain a formatted output of what mgdraw scores.
This is the .out file I am referring to: baselineW001.out (80.6 KB)
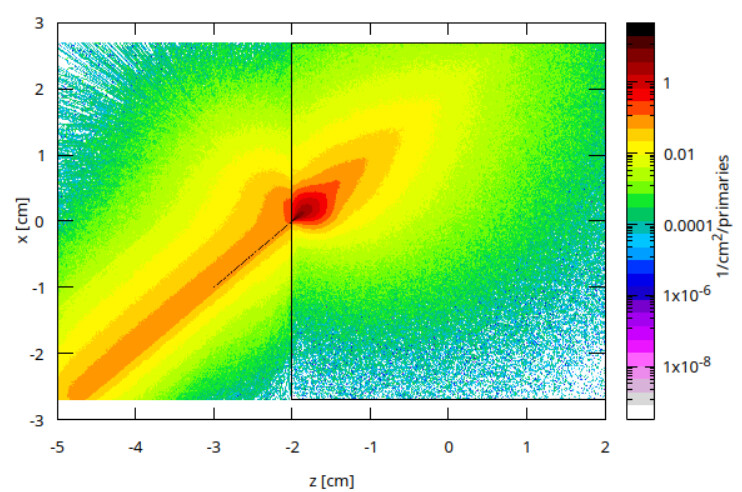
One last question: by setting BEAMPOS, do I define the point where the electrons are generated, or does it specify just their direction?
I’m asking in order to better understand what I’m seeing in this fluence plot.
In the BEAMPOS card, you can define both the location (x, y, z) and their direction (cosx, cosy). In your fluence plot you can see the black line of primary beam electrons (starting at x=-1, z=-3), at an angle of 45 deg (or cos=0.7070), hitting a target, leading also to backgscattering electrons. Note that in your colorbar axis, the “/primaries” is not correct, per my comment #4 in my first answer in this post.