Dear @d105291,
-
Please consult this post to get a formattted mgdraw output.
-
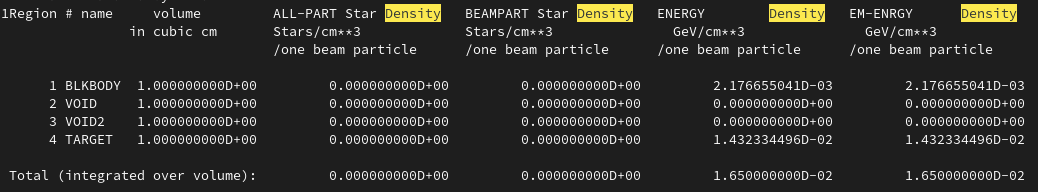
I cannot find any “Events by region” section in your file, but I assume you mean this part of the *.out file. In this case, yes.
-
In the BEAMPOS card, you can define both the location (x, y, z) and their direction (cosx, cosy). In your fluence plot you can see the black line of primary beam electrons (starting at x=-1, z=-3), at an angle of 45 deg (or cos=0.7070), hitting a target, leading also to backgscattering electrons. Note that in your colorbar axis, the “/primaries” is not correct, per my comment #4 in my first answer in this post.
Best,
Daniel