Sample angular distributions from a histogram with respect to a custom coordinate system

Dear FLUKA experts and users,

Following the similar posts Angular distribution with source newgen and Implementation of an anisotropic source from mcnp in source_newgen.f I am trying to implement a neutron source with a predefined polar angle cos(\theta_{n}) distribution and a uniformly distributed azimuthal angle \phi_{n}.

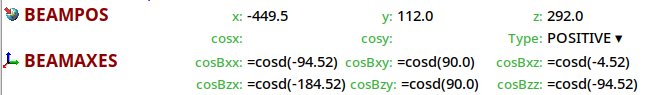
This is assumed that these neutron are the secondary particles (not in the context of the simulation) produced in inelastic interactions of the primary (not the model-wise as well) 18 MeV protons with a target. The proton beam has a specific direction in \mathbb{R^{3}} which does not align with the default FLUKA beam direction along z-axis. Therefore I set a BEAMAXES card with a new beam’s coordinate system rotated to match the actual protons’ direction:

image

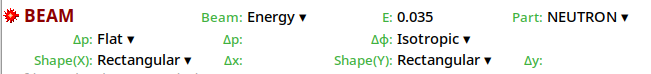
Since I am creating the neutron source the BEAM card is specified for neutron particle with the E what value defined noticeable higher than the maximum spectra value (the neutron energy is sampled from an external file using sample_histogram_momentum_energy function in the source_newgen.f user routine) and isotropic beam divergence:

image

The both \theta_{n} and \phi_{n} angles are defined with respect to the proton beam direction:

  1. The polar angle should have the following distribution


    with respect the new z' axis.

  2. The azimuthal angle is lying in the x'y'-plane perpendicular to the z'-axis and should have the uniform distribution in the range of [0, 2\pi] radian.

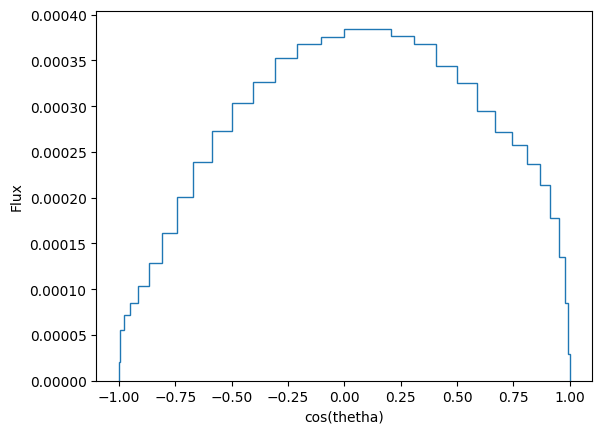
To reproduce these angles distributions I used sample_isotropic_direction subroutine and did overwrite direction_cosz variable to be assigned to a value sampled from a file which contains the histrogram shown above:

      call sample_isotropic_direction(direction_cosx, direction_cosy, direction_cosz)
      direction_cosz = sample_histogram_file("theta.txt", 1D0)

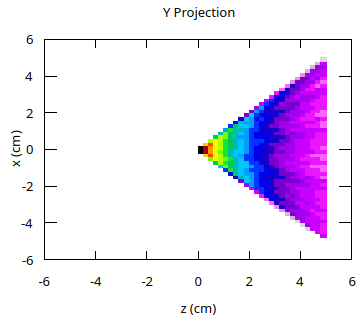
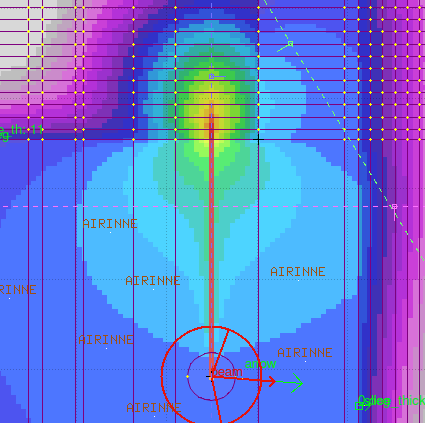
I used USRBIN card to score the neutron radiation field and try to visually ensure correctness of that approach:

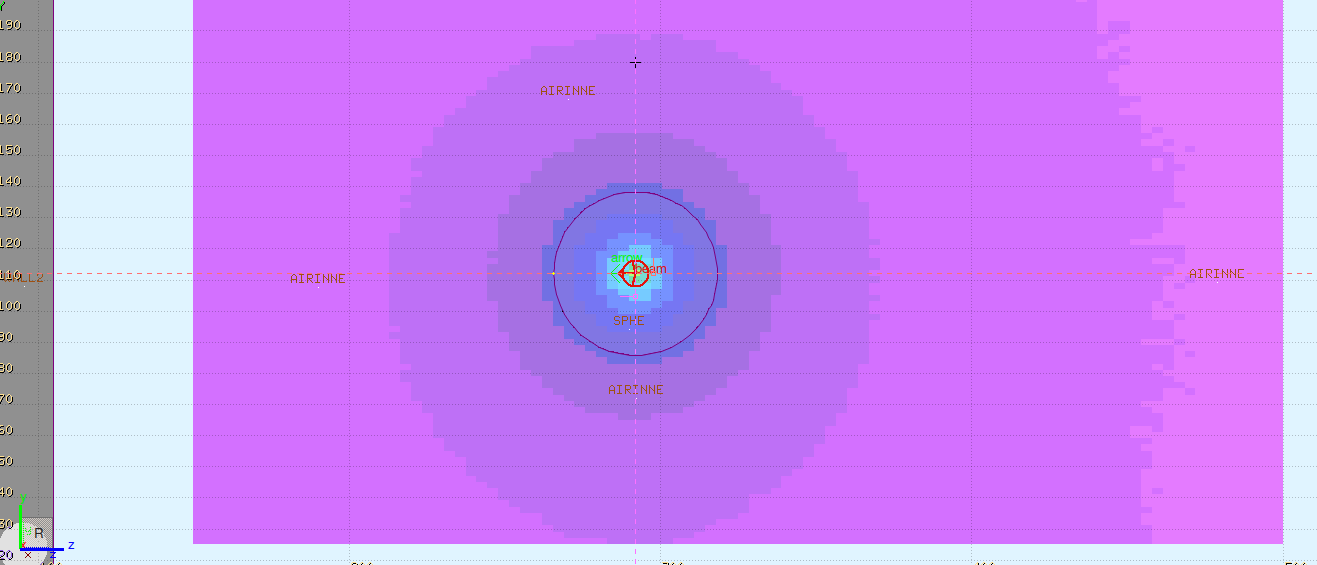
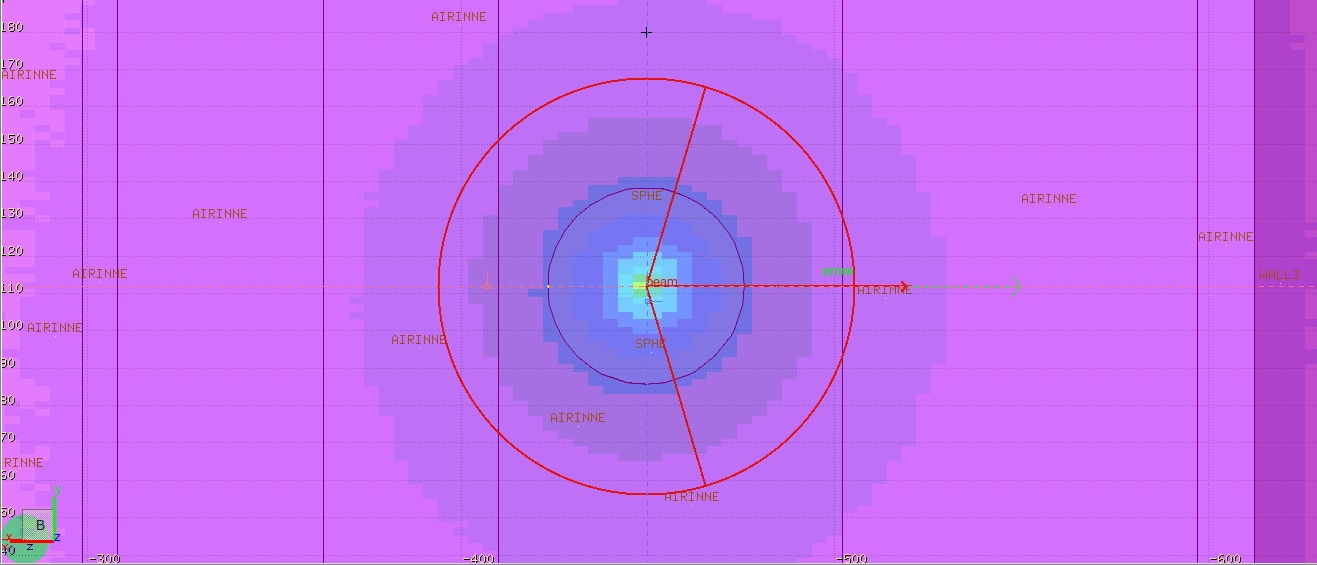
I expected that the radiation field should’ve taken advantage for the directions close to normal to the z'-axis, where \theta_{n} is close to 90 deg and cos(\theta_{n}) becomes equal to zero. But giving the images above (e.g. XZ, ZY, XY projections) it looks like the radiation field is distributed isotropically.

So, I would like to clarify do I use the correct approach to sample the angles?

Cheers,
Ihor
source_newgen.f (22.4 KB)

FLUKA: 4-5.2
Flair: 3.4-5.4

Dear Ihor Melnyk,

I’d mainly like to comment on one aspect of your question, the implementation of the angular distribution.

Due to the correlation between the three direction cosines (in order to define a direction in three dimensions, you only need two variables, for example the polar and azimuthal angle), the approach you are using at the moment will not give the expected angular distribution.

In the second step, this code almost certainly samples a value for direction_cosz that is incompatible with direction_cosx and direction_cosy. FLUKA re-normalizes the improper direction vector and produces primaries, but their angular distribution is somewhat in between the intended distribution and an isotropic source.

As an extreme example, consider the following modification of your source routine:

      call sample_isotropic_direction( direction_cosx, direction_cosy, direction_cosz )
      direction_cosz = 1.0D0

One might expect that all particles move along the z axis. However, direction_cosx and direction_cosymay be assigned values with an absolute value of up to 1.0 by the isotropic sampler, which clearly conflict with the second instruction. This may produce direction vectors like (1.0, 0.0, 1.0) which would be interpreted by FLUKA as (1/sqrt(2), 0.0, 1/sqrt(2)), i.e. a primary traveling in the x-z plane at a 45-degree angle to the z axis. Indeed, the resulting angular distribution is focused along the positive z axis, but within a 45-degree cone due to the correlation between the direction cosines.

Seeing what an expected pencil beam is turned into, it is no surprise that your distribution, which has a moderate dependence on theta, becomes almost (as mentioned above, what your USRBIN shows is some combination of an isotropic and your expected distribution) isotropic.

In the second forum thread you are referring to (Implementation of an anisotropic source from MCNP in source_newgen.f), @giorgia.fossati’s second proposed method is similar to your source routine, but @horvathd deems it incorrect. The first proposed method there correctly takes into account the correlation between the direction cosines.

Now, on top of sampling from a complex angular distribution, you would also like to rotate that distribution. Personally, I would sample the direction cosines in the standard coordinate system and then apply a rotation matrix to the resulting vector. All of that can be hard coded in source_newgen.f. However, I have a feeling that there is a less error-prone and more efficient way to do it in FLUKA, and I’ll let the experts answer that part of the question.

Cheers,

Udo

Dear @udo.friman-gayer,

Many thanks for your hints and the clear explanation! Now, I really see that the initial approach does not work as I expected.

Actually, after the last run I got a very strange result which absolutely doesn’t match the beam direction I thought I was setting:

The beam direction is mostly aligned with the “traditional” z-axis.
So, I’m going to try the first approach from the previously mentioned post and specify in my case:

      subroutine SOURCE ( nomore )

      use source_library
      use source_variables

      implicit none
      include 'tetgcm.inc'

      double precision mu
      double precision r
      double precision sinph
      double precision cosph
*     .............................................
      mu = sample_histogram_file("theta.txt", 1.D0)
*     .............................................

where the cos\theta = cos\gamma = \mu is the z-axis directional cosine, and than since
cos\alpha = \cos\phi \cdot \sqrt{1 - \cos^{2}\theta} = r \cdot \cos\phi and
cos\beta = \sin\phi \cdot \sqrt{1 - \cos^{2}\theta} = r \cdot \sin\phi

*     ..............................................
      call SFECFE(sinph, cosph)
      r = sqrt(max(0.D0, 1.D0 - mu * mu))
      direction_cosx = r * cosph
      direction_cosy = r * sinph
      direction_cosz = mu

I will see the results only tomorrow after running the simulation over the night, but I’m still slightly confused how to implement and apply a rotation matrix to the (cos\alpha, cos\beta, cos\gamma) directional vector in the source_newgen.f user routine. I mean should I do this manually or there’s something pre-defined? Could anybody suggest anything about that please?

Cheers,
Ihor

Dear Ihor,

Yes, the new sampling code looks better!

I have attached a primitive example for applying an arbitrary 3D rotation to a direction vector. This is how I (FLUKA beginner, absolutely no fortran skills) would implement the functionality.

source_newgen.f (23.9 KB)

angdist.flair (1.3 KB)

For the rotation, I am using Euler angles in the XZX convention. I am not using any linear-algebra capabilities of fortran, but simply implementing the rotation component-wise. In the example, the rotation is applied to an initial vector (0,0,1), but of course that vector could come from your sampling procedure.

To add some flexibility, the example obtains the Euler angles from the SOURCE card.

Again, there are probably smarter ways to do this, both FLUKA and fortran.

Cheers,

Udo

One more comment:

It is possible that you have strong time constraints and need to run full simulations even if the angular distribution is not entirely correct. For the sole purpose of debugging the angular distribution, however, I would suggest to run extremely simple and short simulations (see my example: empty geometry, simple USRBIN (see below), and a single particle).

Furthermore, depending on the physics case and on how the scorer is set up, a USRBIN scorer may be unsuited for debugging the angular distribution. Your 2D visualization may contain scattered beam particles and secondary particles. There are alternative scorers like USRYIELD that can give you the angle in the laboratory frame, for example.

Lastly, I have been using the

debug_logical_flag = .true.

option in source_newgen.f as an easy way to debug my Euler-angle rotation. Uncommenting this line will print (among other things) the initial direction cosines of the primary particles into FLUKA’s .err output file.

Cheers,

Udo

Dear Udo,

Thanks for the advice and the example! The component-wise matrix multiplication is exactly what I meant by doing the rotation “manually”.
I ran the angdist example with a single particle in 1000 cycles spawned to 10 CPU threads to accumulate statistics, but I’m not sure about post-processing and merging the results (the output fort files). I was waiting about 10 minutes alter clicking Process button in Flair and nothing has happened, so I just interrupted the process. Typically, that process aimed to process and merge data from significantly larger data samples takes from several seconds up to a couple of minutes depending of the data size.
One minor question about the angdist example: are you able to merge at least few fort files after running the angdist on your machine? If so, than something wrong happened with my Flair setup.

Cheers,
Ihor

Dear Ihor,

It’s primitive and error prone, but it works :slightly_smiling_face:

There is no need to accumulate statistics with the example that I sent. All primaries are sent in exactly the same direction, and they will perform no interactions due to the geometry consisting entirely of vacuum. I created this example just to demonstrate how the primaries’ initial direction is changed. The easiest way to see this is to look at the .log(sorry, not the .err output file as I said earlier) output file from the FLUKA run.

I do not know why flair struggles with the large amount of output files, but 1000 cycles on 10 CPUs for just a single primary is a very inefficient use of computing resources when the simulation time for a single primary is negligible small. You are creating an unnecessary amount of computational overhead for managing all the cycles and threads.

In general, how to distribute the desired amount of particles among cycles and threads depends on the specific application and the desired statistics.

Yes, I can merge results from multiple cycles in the example.

Cheers,

Udo