Dear FLUKA experts,
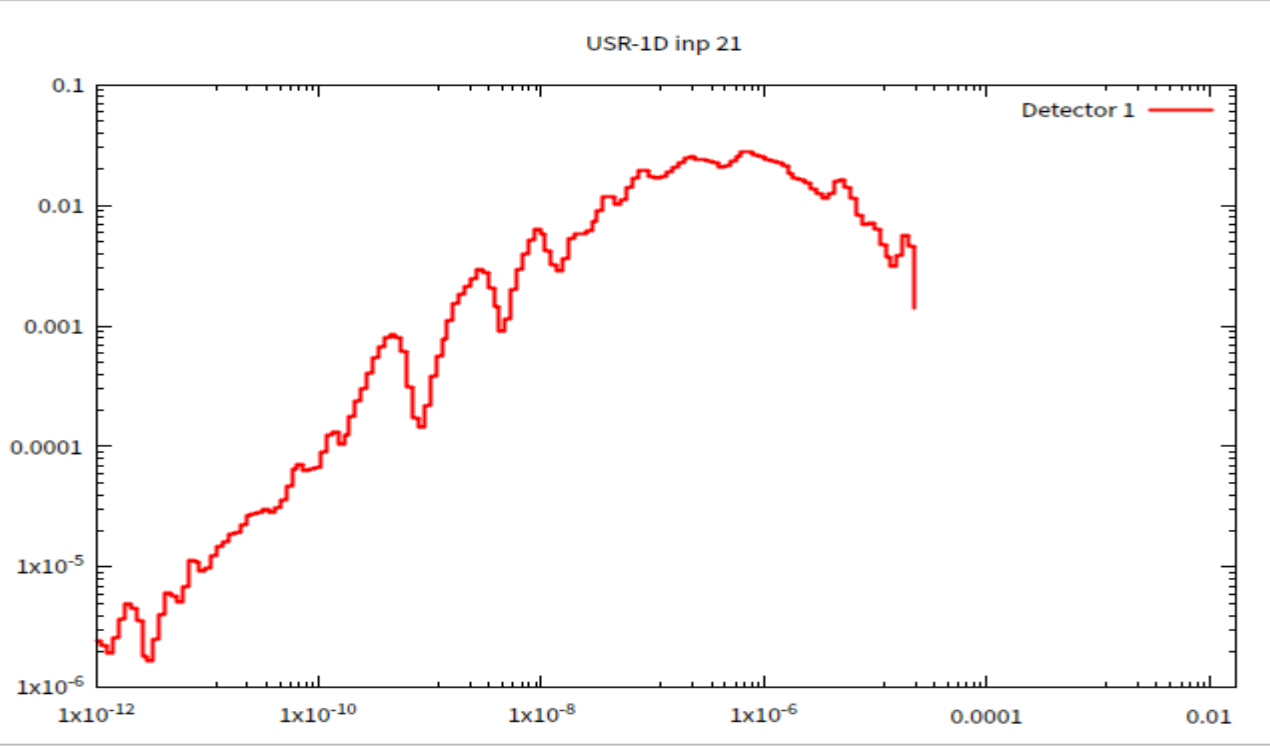
I defined a non-mono energy source using the file ‘source_newgen.f’, which reads data from the spectrum file ‘muspectrum.dat’. To verify that the input is correct, I used USRBDX to count the energy distribution of the initial particles and found that the output is completely different from my input spectrum. I don’t know why. I hope experts can give me some guidance.
Thank you very much for your help and answer! Looking forward to your reply. Wish you the best of luck in everything.
Very thankful!!!
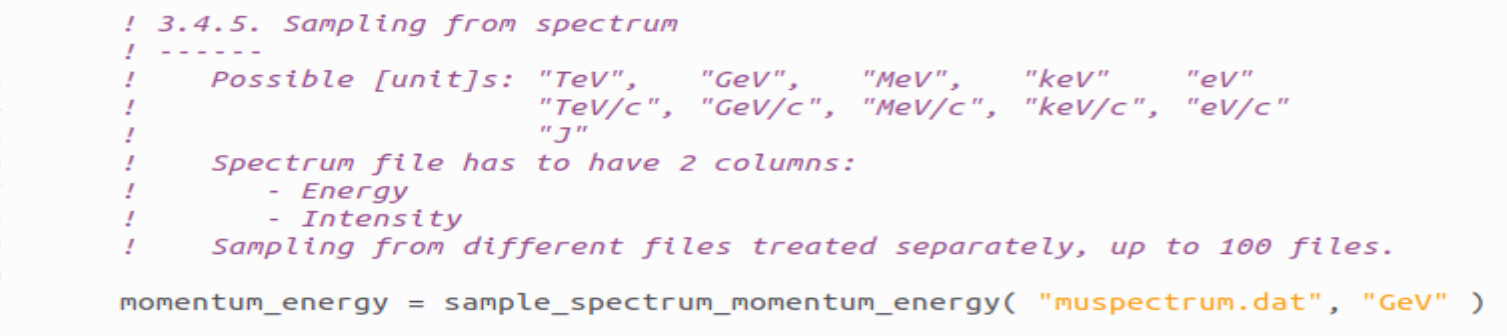
This is the input command I use:
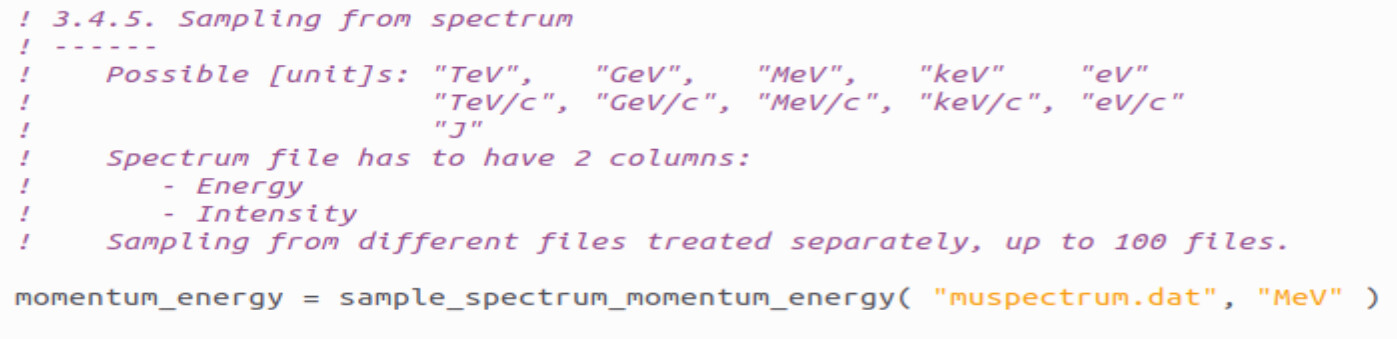
Another problem is that when I change the units to “MeV” and “GeV” in the “source_newgen.f” file, the final output is actually 6 orders of magnitude different. I don’t understand it, but the input card settings should be fine? I’ve done similar ones before and they were fine.
(1)
Dear @horvathd ,
Thank you very much for your answer.
1.I understand the settings for energy and momentum. Previously I thought that setting the unit to “GeV” would indicate energy.
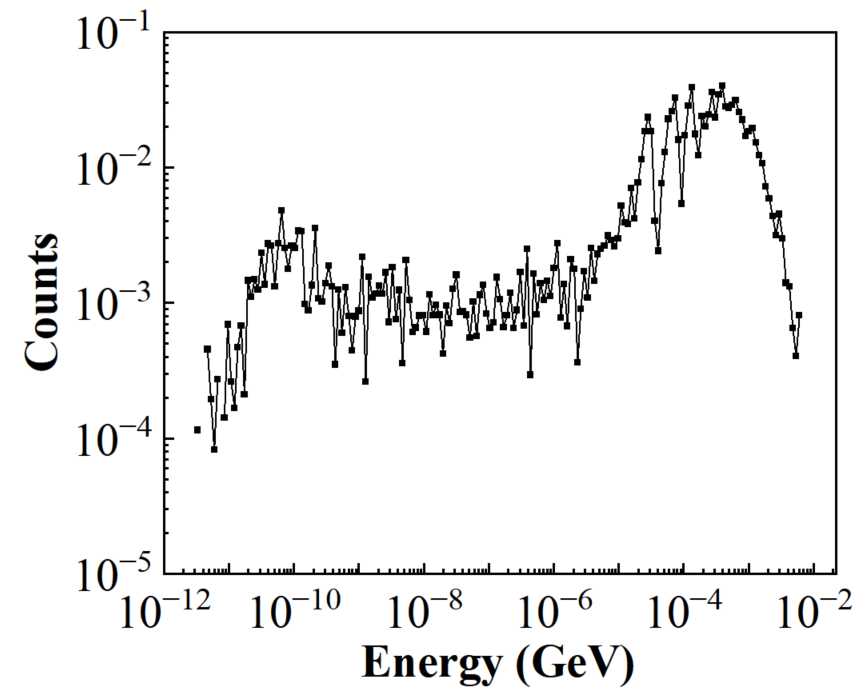
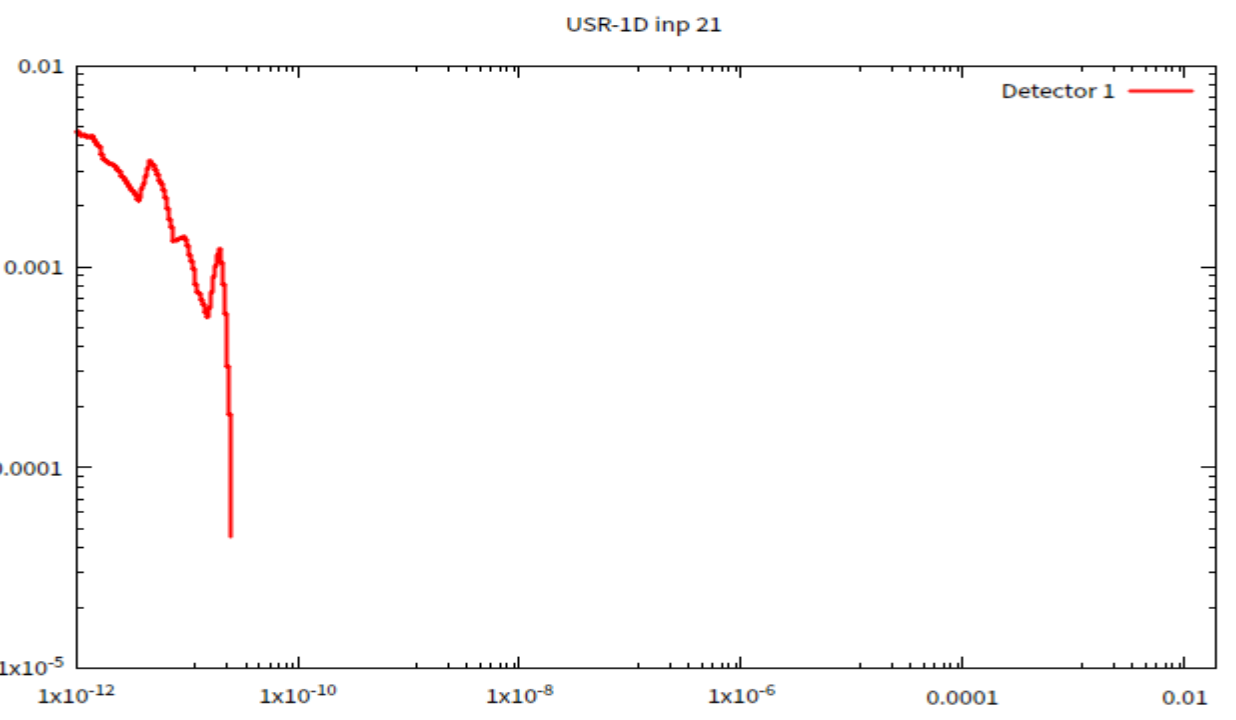
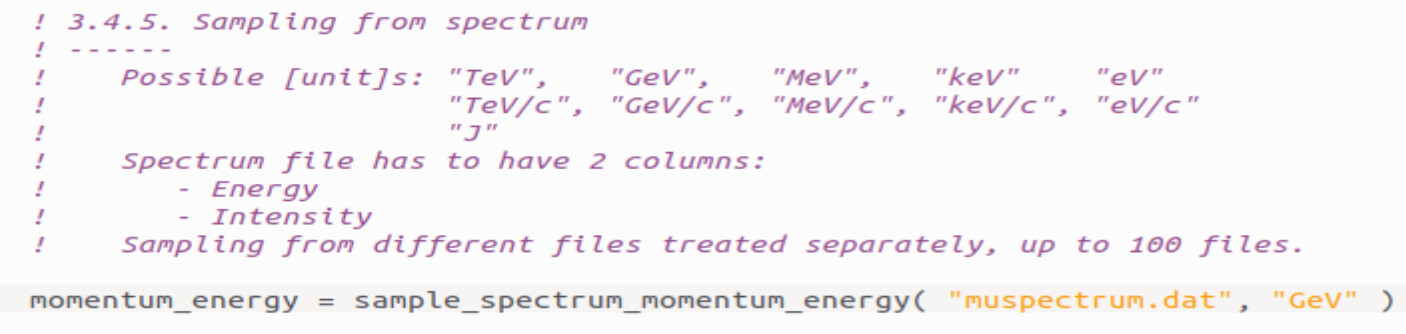
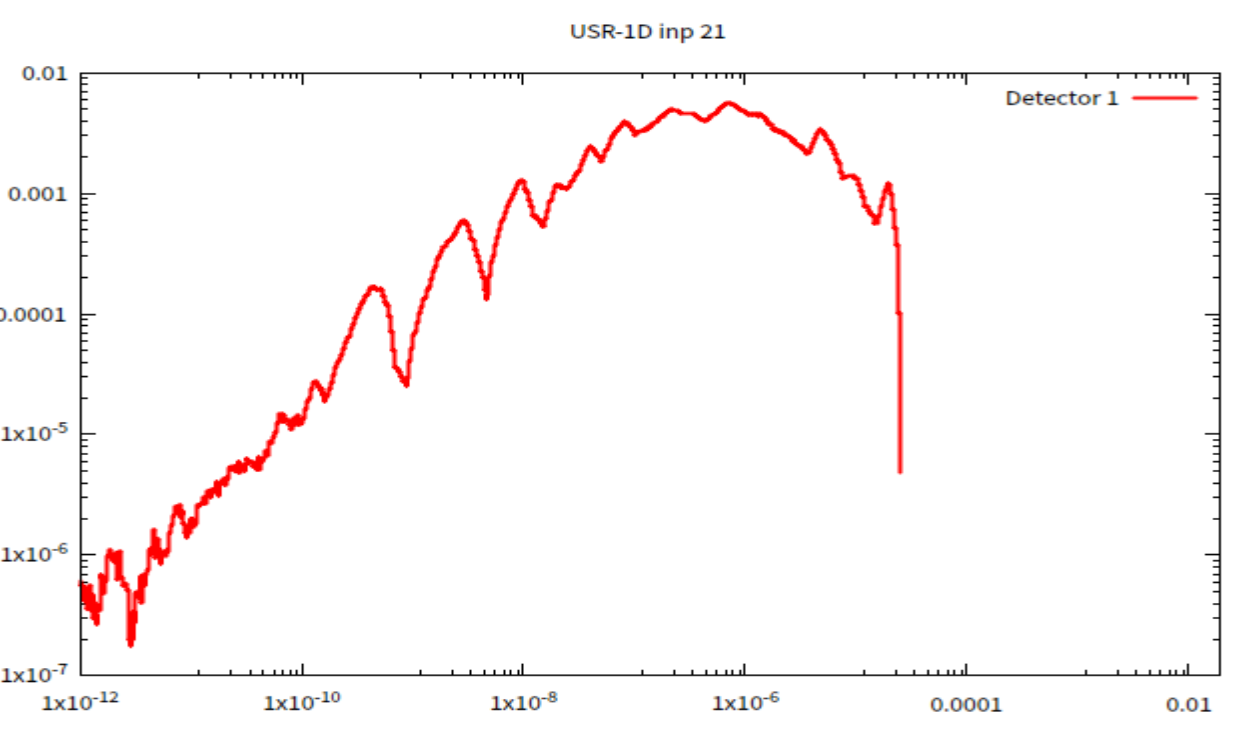
2.But I still have some problems with the data files. In the file “source_newgen.f”, there are three types of energy spectrum input methods: Sampling from histogram, Sampling from spectrum, and Sampling from discrete spectrum lines. For the “Sampling from histogram” method, three parameters need to be input: Emin, Emax, and dN/dE. I have no issues with this. However, for the “Sampling from spectrum” method, two columns of data are required: Energy and Intensity. In the appendix file “muspectrum.dat” mentioned above, the first column represents Energy, and the second column represents Intensity. Using the data in “muspectrum.dat”, I plotted the input energy spectrum, which comes from the output of the MCNP. Then, I use USRBDX to tally “BEAMPART”. The “tab.lis” file contains four columns of output data: “Emin”, “Emax”, “dN/dE”, and the error. When plotting, if I select “Value” as “Y”, the y-axis value represents “dN/dE”. The shape of the curve in this case is consistent with the data in “muspectrum.dat”. But when I choose “DXY", the y-axis value represents “dN”, yet the shape of the curve is completely different. In my understanding, the values in “muspectrum.dat” should correspond to "DX Y” rather than “Y”. So, does this imply that the “Intensity” in the context of “Sampling from spectrum” represents “dN/dE” instead of “dN”? Therefore, should the values in the second column of the data file be “dN/dE”? But since there’s only one column of energy values, dE =dEn+1 - dEn? In the case of “Sampling from discrete spectrum lines”, does “Intensity” represent “dN”? Please forgive me if my understanding is flawed or incorrect.
Wish you the best of luck in everything. Very thankful!!!
Lin
I’m fairly sure that the Counts label is misleading.
If the spectrum comes from a MCNP simulation, the point on the graphs should represent a histogram, where instead of Emin and Emax, the Emean is given.
Also, it seems that the plot is in lethargy units, which sould be converted back to be able to use correcly in FLUKA.