I am simulating an extrapolation chamber (parallel plate chamber). I have used Kr-85 source. The volume of the total active region changes as I change the electrode plate separation
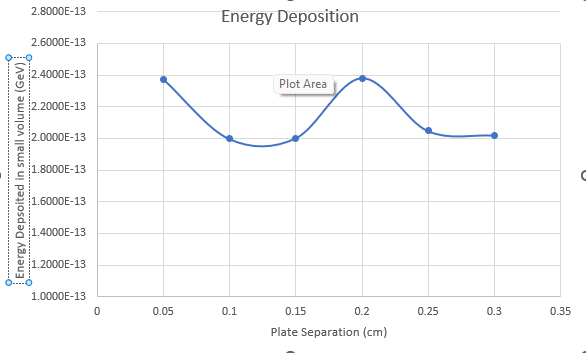
I have taken a small volume (cylindrical region of 0.01 cm height and 0.25 cm radius) of the total active region and scoring energy there. Now, when I change the plate separation and score energy in the same small volume, I see spikes in the energy deposition. And these spikes are persistent only when plate separation is 0.2 cm
I understand that this arises due to the very small volume. But I don’t understand which card to use - FLUKAFIX or MULSOPT or both. Also, I have kept the electron cutoff at 1E-5 GeV. Should I reduce it to 1E-6 GeV?
To best help you, please upload your FLUKA *.inp file, such that I can double check all physics settings and thresholds.
\text{Kr-85} emits primarily beta radiation (up to 680 keV) - so an electron cutoff as low as possible is better for you.
For small detector sizes, MULSOPT is suggested to force single scatterings since only a few of them would actually happen in the small geometry. By default, FLUKA uses Multiple Coulomb Scatterings, handled using an optimized condensed transport algorithm based on the Molière theory, an assumption which holds well for larger geometries where there are multiple scatterings to average over.
FLUKAFIX on the other hand can be used to reduce (or increase) the particle step, but should not be needed for most applications.
3mm.inp (3.9 KB)
I am calculating the ratio of dose deposition in ACTVOL to (TARGET+ACTVOL) for different plate separation i.e., changing the thickness of TARGET from 0.3cm to 0.05cm in the units of 0.05cm. And when I plot for the ratio v/s the plate separation there are dips/kinks. I think that is because the dose / energy deposited in the ACTVOL is not correct as it is AIR and very small dimension.
The energy deposited in the ACTVOL and TARGET is low i.e., of the order of 10^-11 GeV and 10^-8 GeV respectively. When i score energy deposition, the uncertainties in both region is <1%. I am running 9x10^7 primaries.
The uncertainty in sum.lis file is - “Tot. response (p/cmq/pr) 1.0000078E-02 +/- 0.1052223 %”
Also when I score the in the ACTVOL, it is a pretty smooth graph.
I really don’t understand what is the issue with the simulations.
Then what’s the problem?
With your input, I get a regular behaviour for the amounts of energy deposited in ACTVOL and TARGET, respectively, as well as their ratio.
I had marked the axis wrong, it was actually dose deposited
The graph is smooth i.e., the USRTRACK scored in the ACTVOL is a smooth spectrum but the problem is that when i plot the ratio with the plate separation, a straight line should come but I get random spikes.
By regular behavior, do you mean that the plot of energy deposited in the ACTVOL v/s plate separation is a smooth graph?
To clarify, I hope you are plotting the ratio of the dose scored using USRBIN, not USRTRACK?
Can you upload the dose vs. separation distance for the TARGET, ACTVOL and their ratio?
Yes - by regular, we mean that the values in the regions increase with increasing separation distance, with no apparent irregularities.
Looking at your simulation geometry, you have a very wide (radius of 6 cm) source cylinder hitting a smaller target that is very close. With increasing target thickness, more particles can enter the TARGET region from wider angles from the source thereby increasing the dose deposited. We also assume that some of these electrons might “backscatter” into the ACTVOL region, increasing the dose here as well.