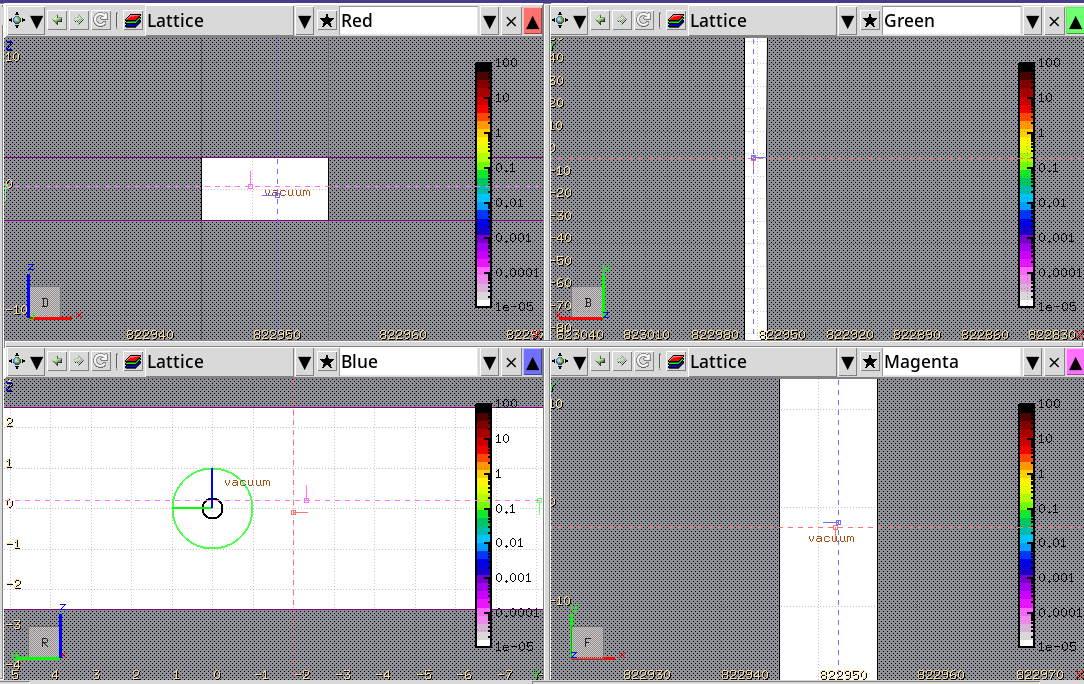
I use USRBIN to count the synchrotron radiation power deposited around beam-pipe (without lattice, as the first flair file shows). Then I place 4 lattices alone the beam-pipe and the length of each lattice is 4 meters (see the second flair file). The y-axis interval of 4 lattices are around (-200,200), (210,610), (620,1020), (1030,1430).
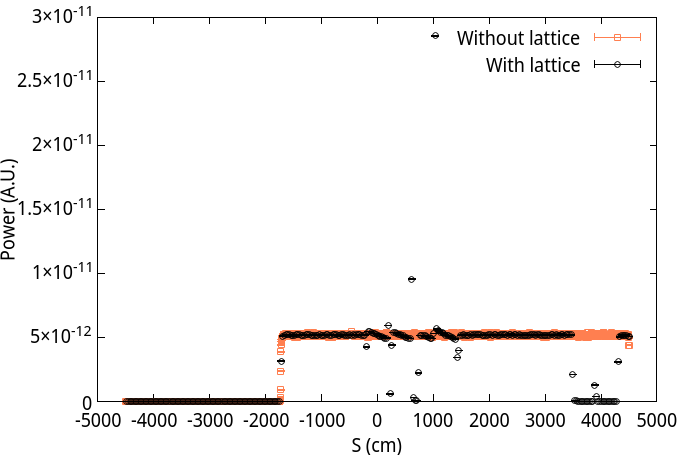
The comparison is shown in the bellow figure. The fist method (without lattice) gives a flat SR deposited power as expected, but the second method (with lattice) shows a fluctuated curve in the 4 lattice ranges.
I had a look at your simulation and, as you suspected, there is a small mistake. You have indicated all vacuum regions as magnetic, but the SYRASTEP card is only applied for the regions vacuum and lat1vac. Instead, you should activate the SYRASTEP card for all regions, which can be achieved by calling the SYRASTEP card without any region entries.
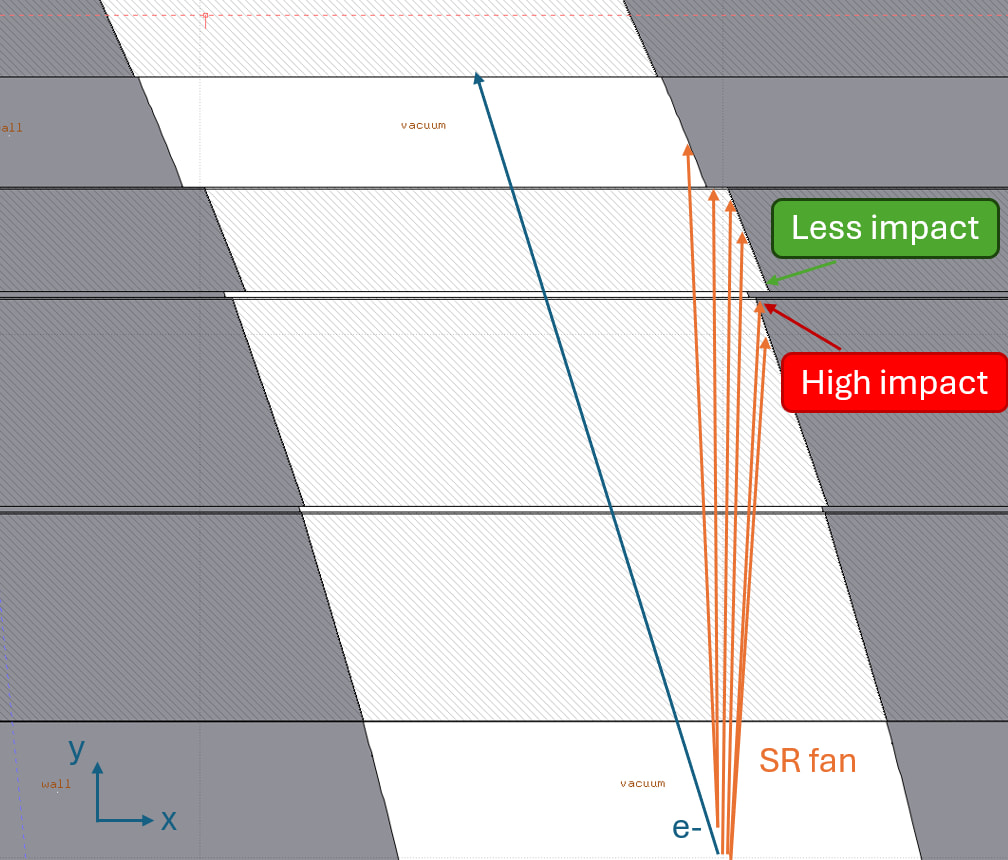
For future simulations, I recommend running a simulation with a USRDUMP card to check whether synchrotron radiation is implemented as intended. In your case, you would like to see a SR fan going all along your beam line.
Even with the correctly implemented SYRASTEP card, you will still see a pattern in the energy depostion for the lattice setup. This is a physical effect due to the staggered placement of the lattice elements in the beamline. Unlike the design without the lattice, where the walls are smooth, you now have edges and corners in the geometry. Because of these geometrical features, the energy deposition shows a pattern, as some parts of the wall are closer to the beam than others.