Dear Fluka users,
From the discussion with @adonadon in this post Unique ID particle using MGDRAW some issues scaped from the initial question and that’s why I’m opening this new post.
I’m running a simulation with a single high energetic particle (proton 10 PeV) from the top of the atmosphere and extracting information about charged kaons, pions, and muons through the atmosphere regions and underground. To do so, I’m using the subroutine USRDRAW.
Among other things, I’m following the particle shower and marking with a unique_id where the particles have been created and where they have died in the simulation. Nonetheless, there are some outputs that I don’t know how to interpret and if the error comes from my code or another source.
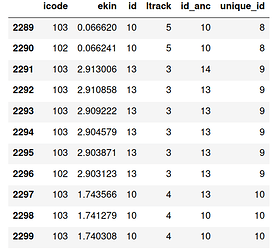
As an example, find below a sliced table with the index (no named), the ICODE of usrdraw (icode), kinetic energy (ekin), the id of the particle (id), ltrack, the parent id (id_anc), and the unique_id generated from post-processing. I got the id_anc using the surpf.f and LLOUSE flag in mgdraw. In general, the results make sense and work well except in some cases.
The first two rows are the last steps of a muon+. The id and id_anc are the same because the muon is transported. Another muon+ is created at index 2297 by decay (icode 102) from a pi- (id_anc 13) and the next rows show its transport.
What I don’t know how to interpret is the creation of that pi- (index 2291) which shows a pi+ as parent id (id_anc 14). This combination of 13 as id and 14 as id_anc and vice versa happens sometimes.
It also appears a few times Kaon- creating a pion+ and vice-versa.
I’m also attaching the user routines, the input file and the material cards in case these are useful for the analysis.
decay_acc.inp (9.4 KB)
atmomat.cards (28.7 KB)
stuprf.f (1.9 KB)
USRDRAW2.f (6.7 KB)
Thank you in advance,
Jordi
