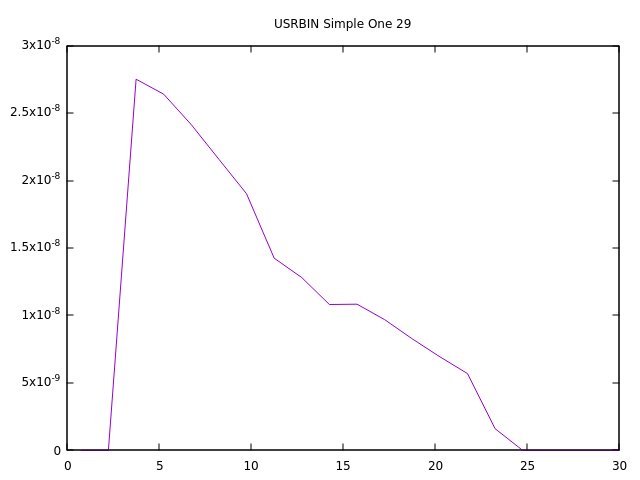
I have thoroughly reviewed the Beginners’ course material and relevant literature. As of now, I have been successful in detecting the defect by utilizing the USRBIN card with energy scoring. I have attached the 1D projection of the results. The void is clearly detectable in this case.
However, when I introduced the irostrand, I was unable to observe the presence of the strands. Additionally, I employed the USRBDX card with energy scoring, but I did not observe any information regarding the scattering angle. This has left me confused about how to determine the angle and energy of the backscattered X-Rays. I came across a similar study that has already been conducted (Study of a Compton backscattering wall defects detection device using the Monte Carlo method).
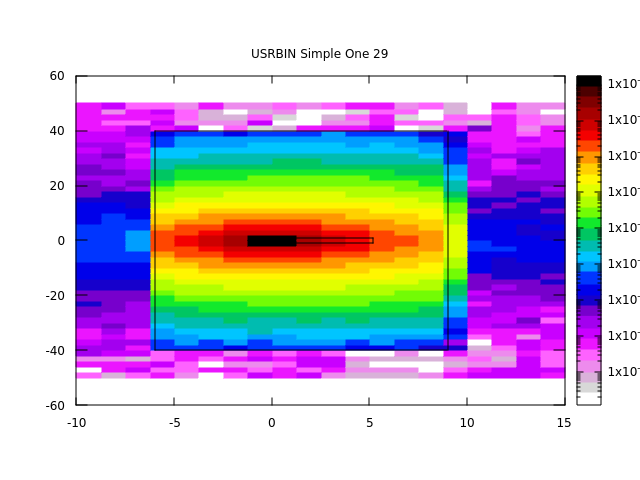
Furthermore, I noticed that while the 1D projection of USRBIN shows the defect, the 2D projection does not provide the same level of clarity. I have attached my updated input file for your reference.
I would greatly appreciate any insights or guidance you can provide to help me overcome these challenges.
I will try to reply in points to your doubts, giving a look at your input file attached.
I assume that you are detecting the presence of the hole in the 1D plot due to the flat part between z = 13 cm and z = 16 cm, but I suspect this is given more by the presence of polyethylene along the beam axis than the one of air (that instead is off-axis).
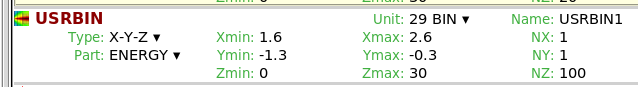
A priori, since you are scoring ENERGY, and we expect a very low energy deposition in the air (almost 0), I would have expected an larger drop in the values at the hole location. The result you got is explained by the quite coarse mesh you are using with USRBIN (plus, I suggest to avoid having the beam exactly at the border between two bins of a mesh, as it is in your case along x) and by the plot that you have done.
For the latter, I suggest you have a look to the beginner course lesson on flair. This might help you in creating a more significant plot and in understanding better the difference between the 2D and 1D plot.
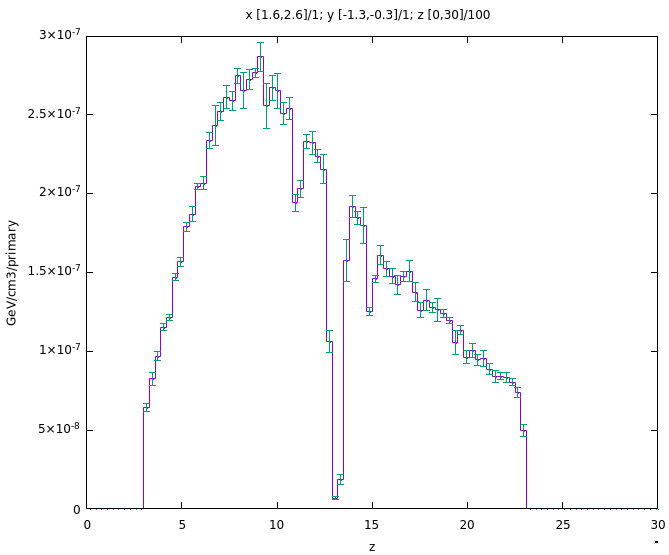
Just for your reference, changing the resolution of the USRBIN mesh you used and focusing on the offaxis position, I got the following result where you can see the drop in the energy deposition at the location where there is the air hole and also at the place where you have the polyethylene tube.
Regarding the USRBDX card, I suggest to have a look to the slide and to the manual in order for you to consider if this is the right scoring you need for your specific case. Just a note, USRBDX gives the possibility to score a double differential spectrum (in energy and angle) but to do so you need to express not only the energy interval you are interested in, but also the angle (in the input file attached this interval is not expressed). Finally, let me just comment that the number of bins are not expressed in the USRBDX card, this results in FLUKA using some standard values that are 10 bins for the energy and 1 for the angle.
I hope this help you to better understand what is needed for your case!
Dear Giuseppe Mazzola thank you for your detailed reply. I’ll get into it and look at the course again. For now can you please share the updated input file using which you got the graph?
Dear Giuseppe Mazzola,
After reading some course slides of FLUKA I got to know that mgdraw is more suitable for my kind of work. Therefore, I modified the mgdraw script and used BXDRAW to find the particle type, position of the beam, and direction of the beam and the energy deposited by beam. I have some questions.
I got 5 output files from 5 cycles. I will use root for further analysis but how will I handle 5 outputs? do I need to make a single file from 5 files or need to study all 5 one by one.
For the output results I find that there is no change in ZSCO and it remains same (mostly). Is there anything wrong I am doing?
All the values are very small is it also wrong?
Am I doing correct to find the energy deposition within the material by beam?
Finally, I also want to know the beam shower outside is there any special parameter about this in mgdraw?
I also want to find the angle using and I am not sure how to find that. Like I got the direction using CXTRACK, CYTRACK, and CZTRACK how can I find this?
Lastly, I used unit 99 but it did not create the fort.99 file for me.
The input files are attached herewith the email.
I would be very thankful to you for the explanation of the above questions. X-Ray_mgdraw.f (10.1 KB) mgdraw.flair (3.0 KB) mgdraw.inp (2.0 KB) BXDRAW_data.txt (2.7 MB)
since it looks to me your requests are now all regarding the use of mgdraw and relative BXDRAW entry and the input file is also different, I would suggest to open a new thread.
I will then come back to you with some references hoping to clarify your questions.