Dear fluka experts,
I’m confused about the <X>*Y and DX*Y in falir plot.
DX*Y is mean Multiplying the value of the bin, with the width of the bin, what about the value of <X>*Y?
Li
Dear fluka experts,
I’m confused about the <X>*Y and DX*Y in falir plot.
DX*Y is mean Multiplying the value of the bin, with the width of the bin, what about the value of <X>*Y?
Li
Dear Li,
the DX*Y is, as you mentioned, the with of the bin multiplied with the value of the bin, this gives you the integral value of the bin.
with <X>*Y plot option, the value of the bin is multiplied with the average energy of the bin energy. It is used for the log-log isolethargic plots.
Cheers,
David
Does that mean if I want to get a fluence energy spectrum, I should choose DX*Y ?
I don’t quite understand the mean of log - log isolethargic, If you’d like to explain it for me?
Does that mean if I want to get a fluence energy spectrum, I should choose DX*Y ?
Not at all, in order to plot it you should choose Y (which is dN/dE), otherwise the plotted value varies arbitrarily with the DX=dE bin width (this holds for any differential plot, where the plotted quantity should always be divided by the bin width, as it is in the FLUKA result Y).
Nevertheless, if you asked for logarithmic (and not linear) binning, you shall then adopt a logarithmic E scale and plot dN/dlogE = E dN/dE = <X>*Y, being always Y=dN/dE. This would be a lethargy plot.
In principle, for the reason above I would not recommend any DX*Y plot (this may still be useful to other purposes).
I forgot to say I used the USRBDX card, and got the result in units of cm−2 GeV−1
per incident primary in the “tab.lis” file. If I want to get the spectrum in units of cm−2 per incident primary , should the DX*Y be chosen ?
A fluence spectrum, as a function of energy, cannot be in units of cm−2, must be in cm−2 GeV−1 for the reason explained above (unless it’s a lethargy spectrum, i.e. dN/dlogE = E dN/dE = <X>*Y, where GeV-1 is cancelled out by E = <X> [GeV]). If you integrate it over energy (then it’s no longer a differential spectrum), you will get its integral in cm-2, which is already reported for your convenience in the “sum.lis” file.
I have two questions.
If you want to get the value of fluence per energy interval in units of part/cmq/pr, it means that you want to integrate the spectrum (and not plot it). This is obviously dN/dE * dE = Y * DX, which however is not meant to be plotted, since, as I said earlier, it makes the plotted curve scale with the arbitrary bin width.
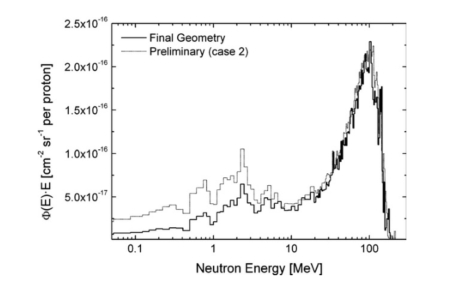
This is the already discussed lethargy plot (on a logarithmic energy scale): phi(E) E = dN dl/(dV dE dOmega) [cm-2 GeV-1 sr-1] E [GeV] = Y * <X>, which is even double differential (as a function of both energy and angle).
Thank you for your reply,I understand it , but there’s another problem. As you said,DX*Y makes the plotted curve scale with the arbitrary bin width,when I score 0-30 MeV neutron spectrum,I’m get two big energy groups (<20MeV and >20MeV), DX *Y gives me a curve of two trends. Should I score them separately?
Add a little more.
I’m afraid that’s because of two different energy gaps(FLUKA’s special treatment for low energy neutrons)
There is no need to score them separately. You should just not plot them as DX * Y, as I tried to make clear (for general reasons) and your example demonstrates well.
Due to the quasi-logarithmic group energy structure, you should better ask for a log binning and plot <X> * Y (lethargy spectrum). The marked artificial discontinuity you would observe otherwise at 20 MeV is the evidence that the DX*Y plotting choice is wrong.
I finally get it. Thank you