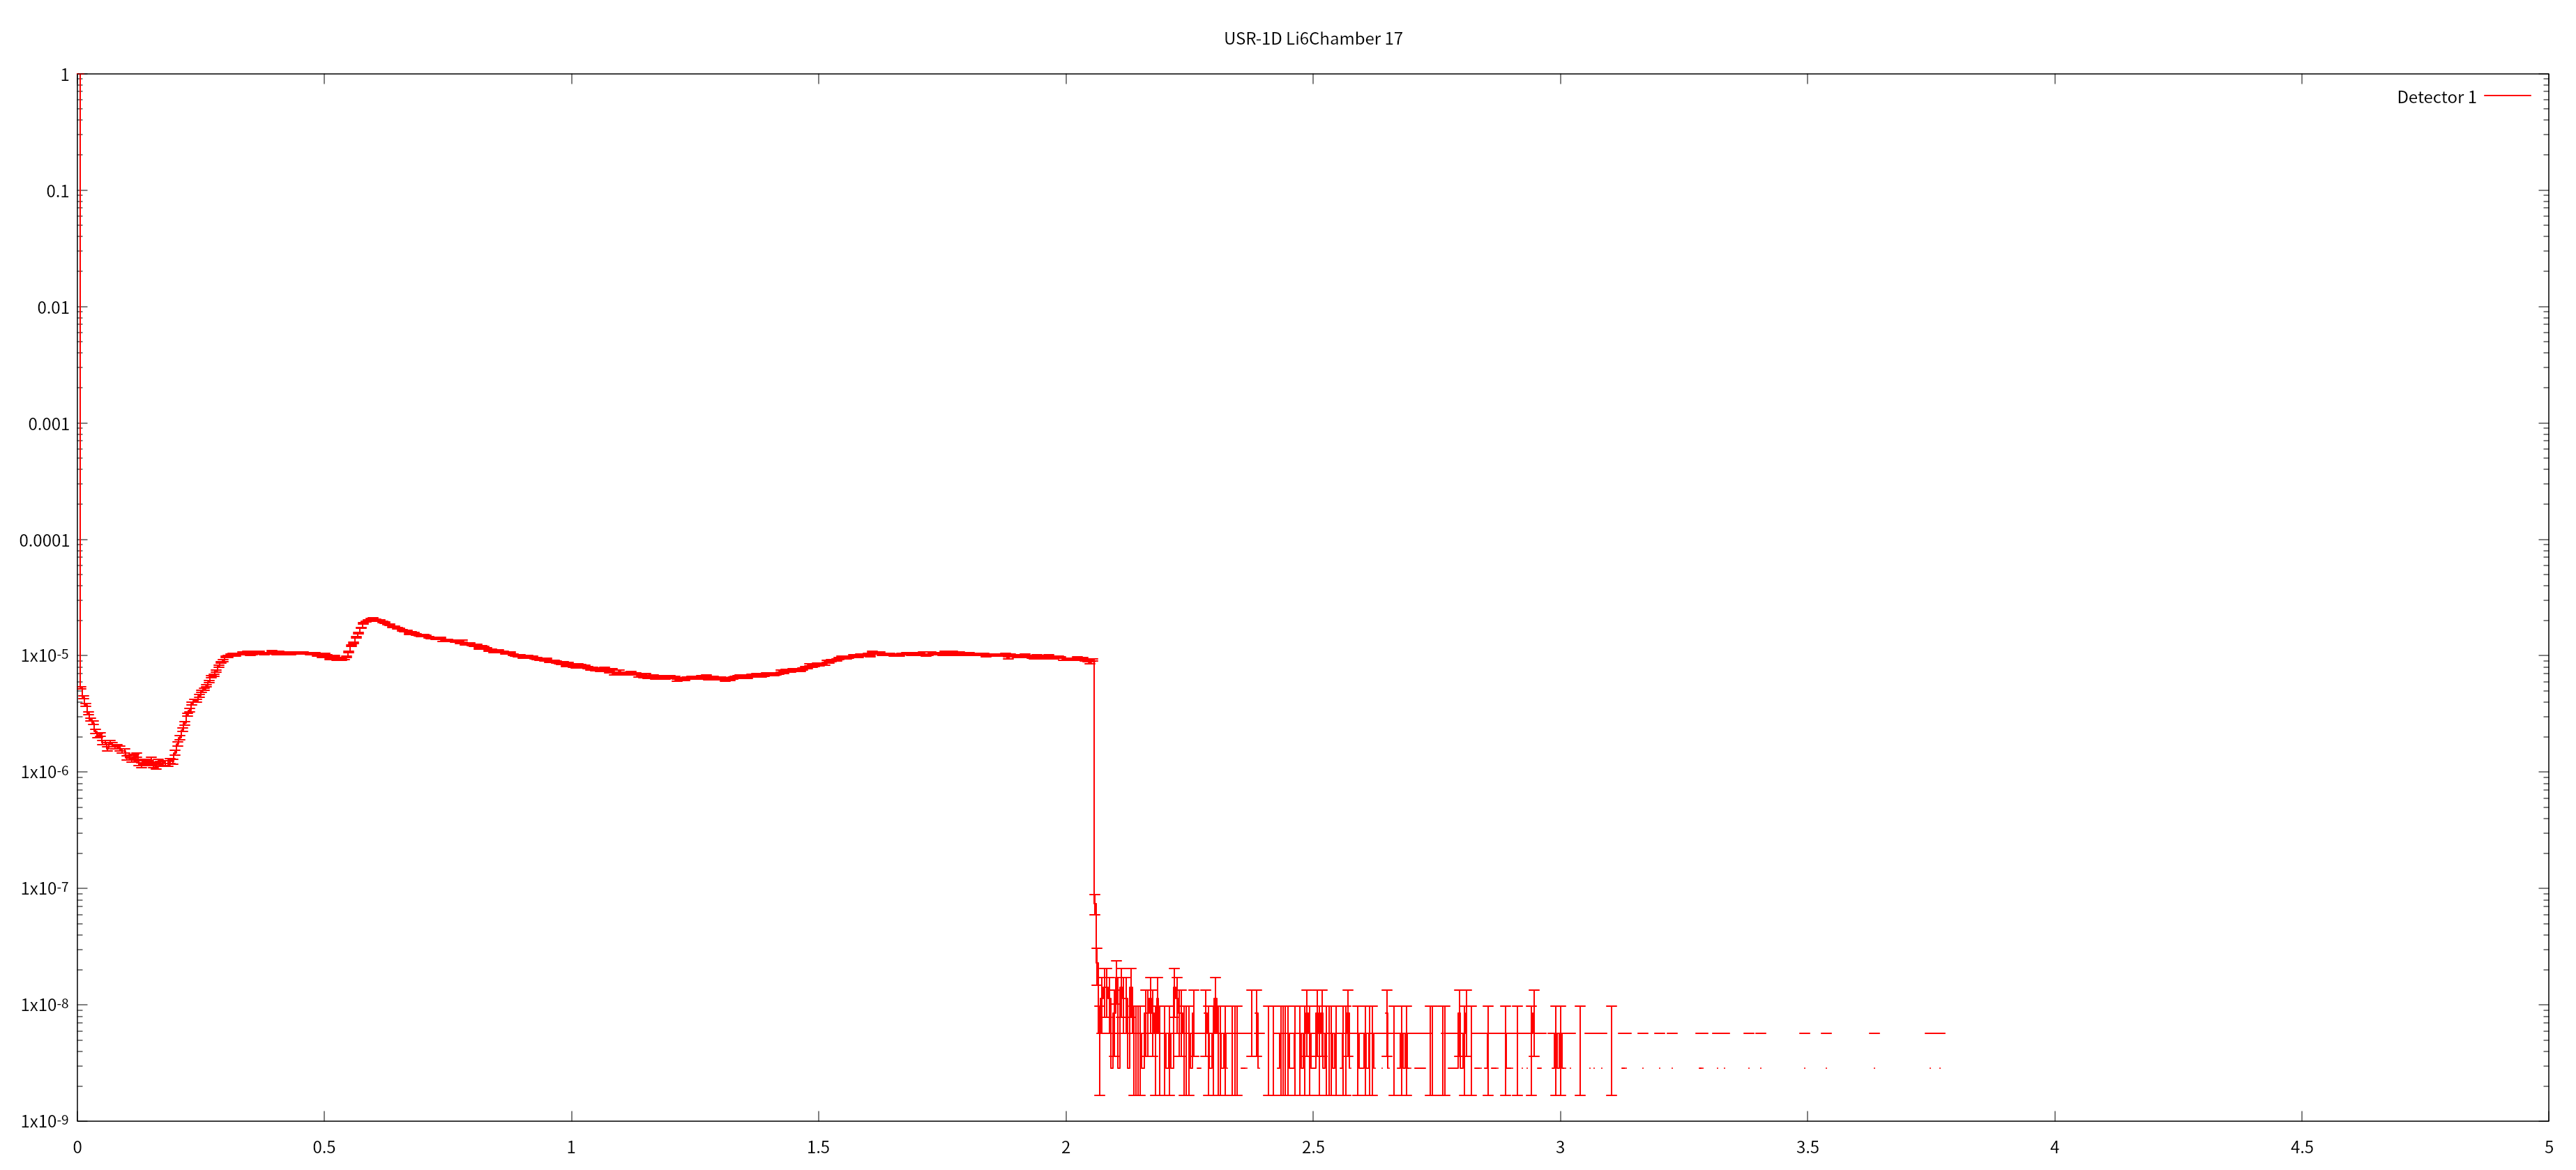
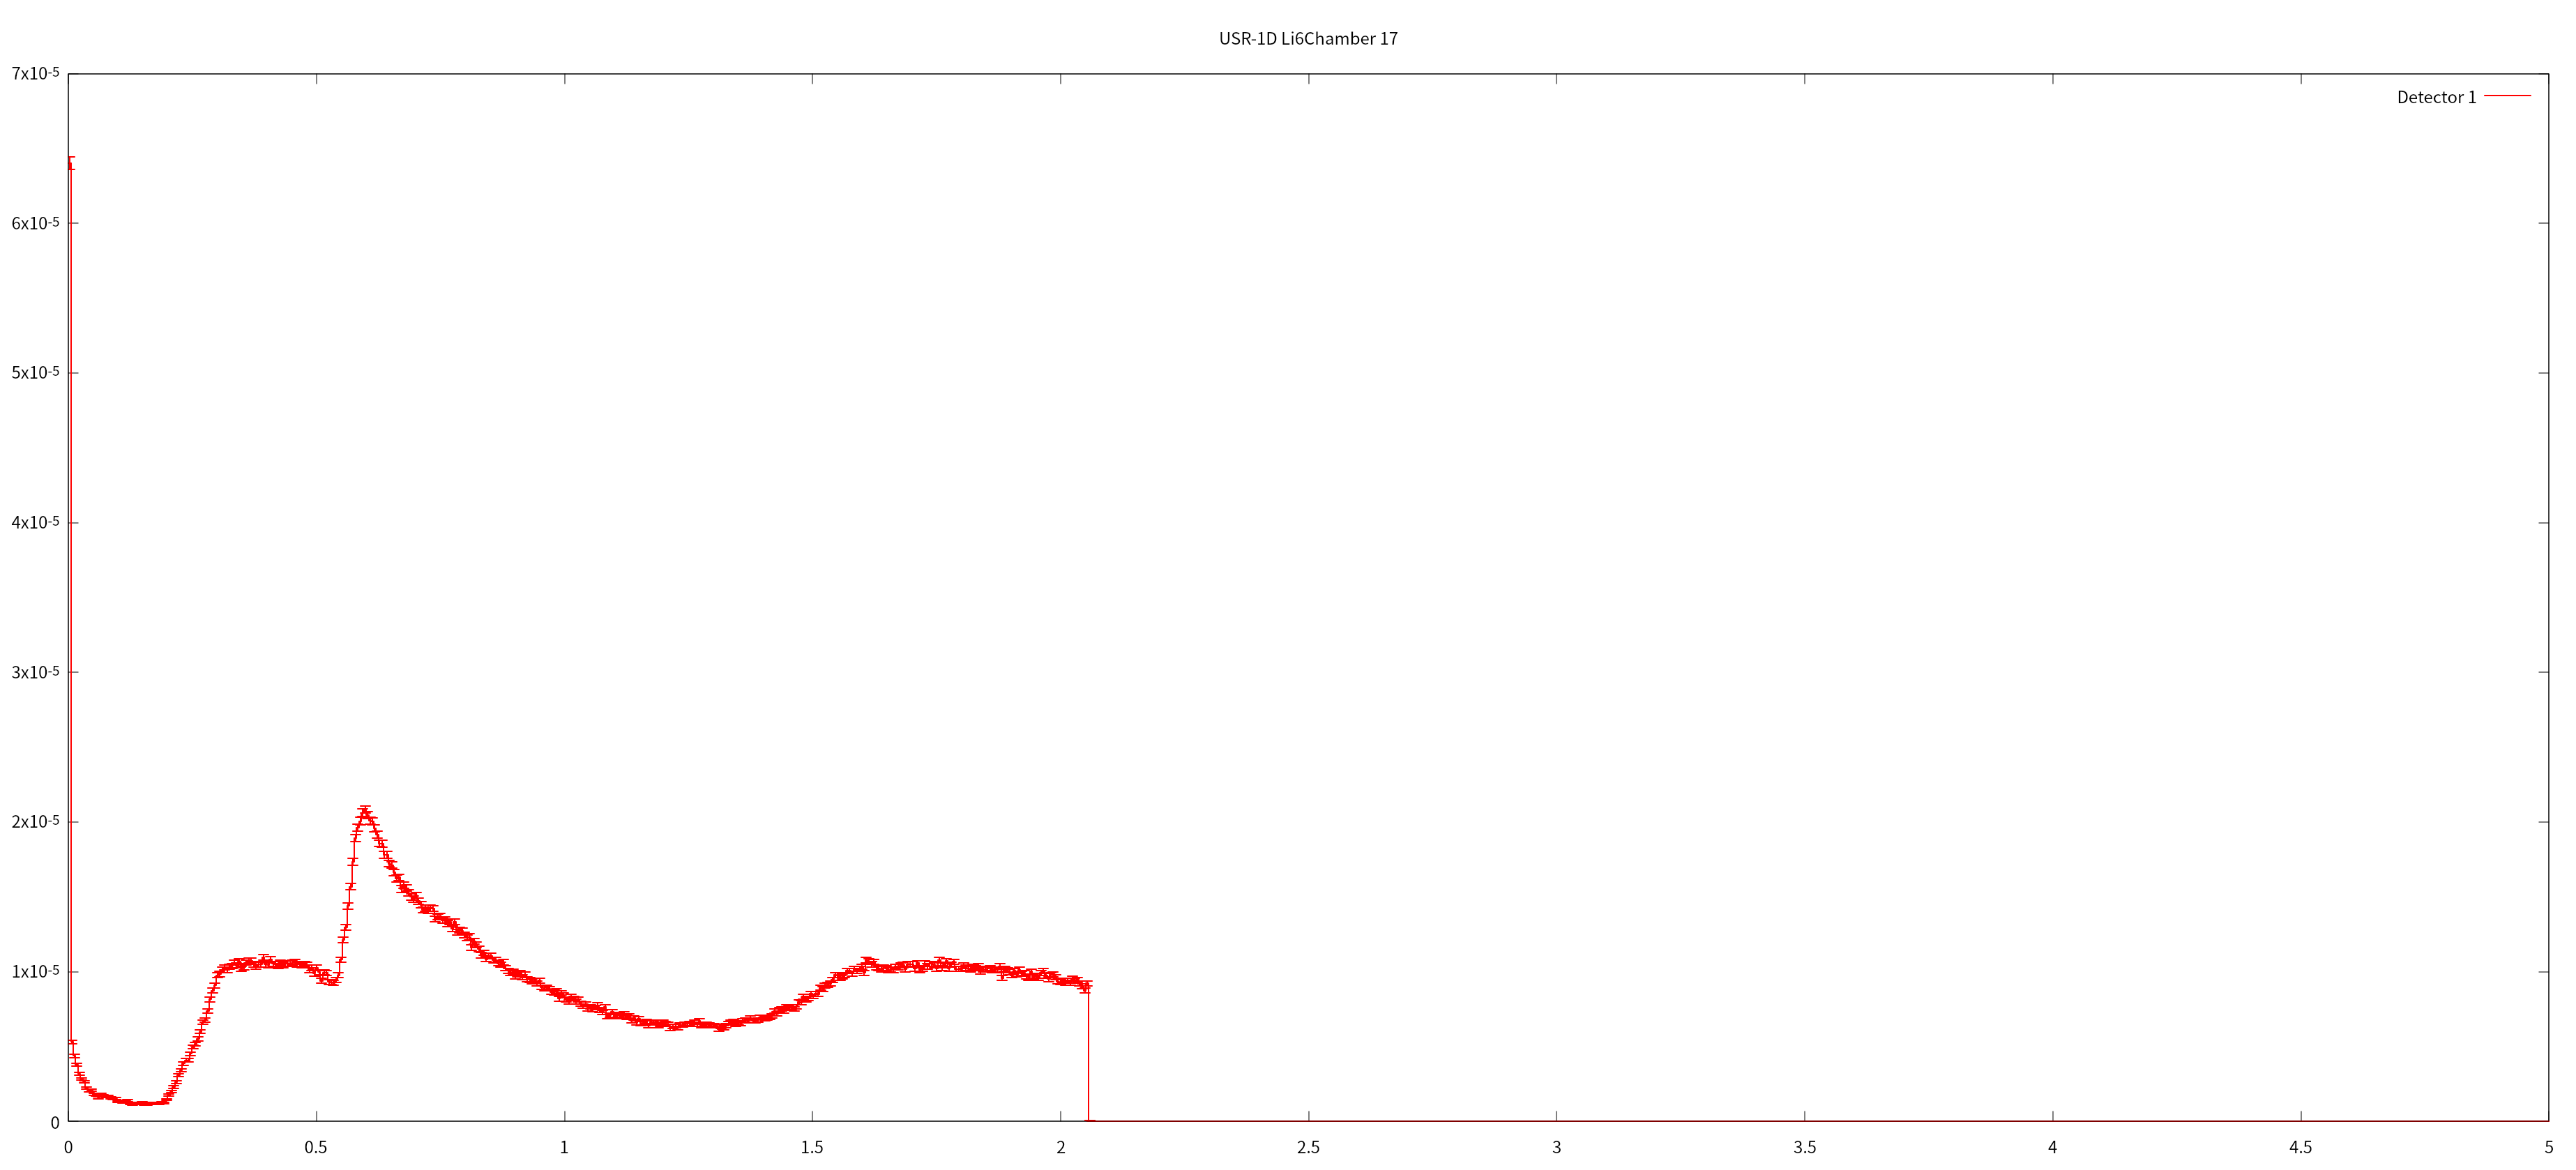
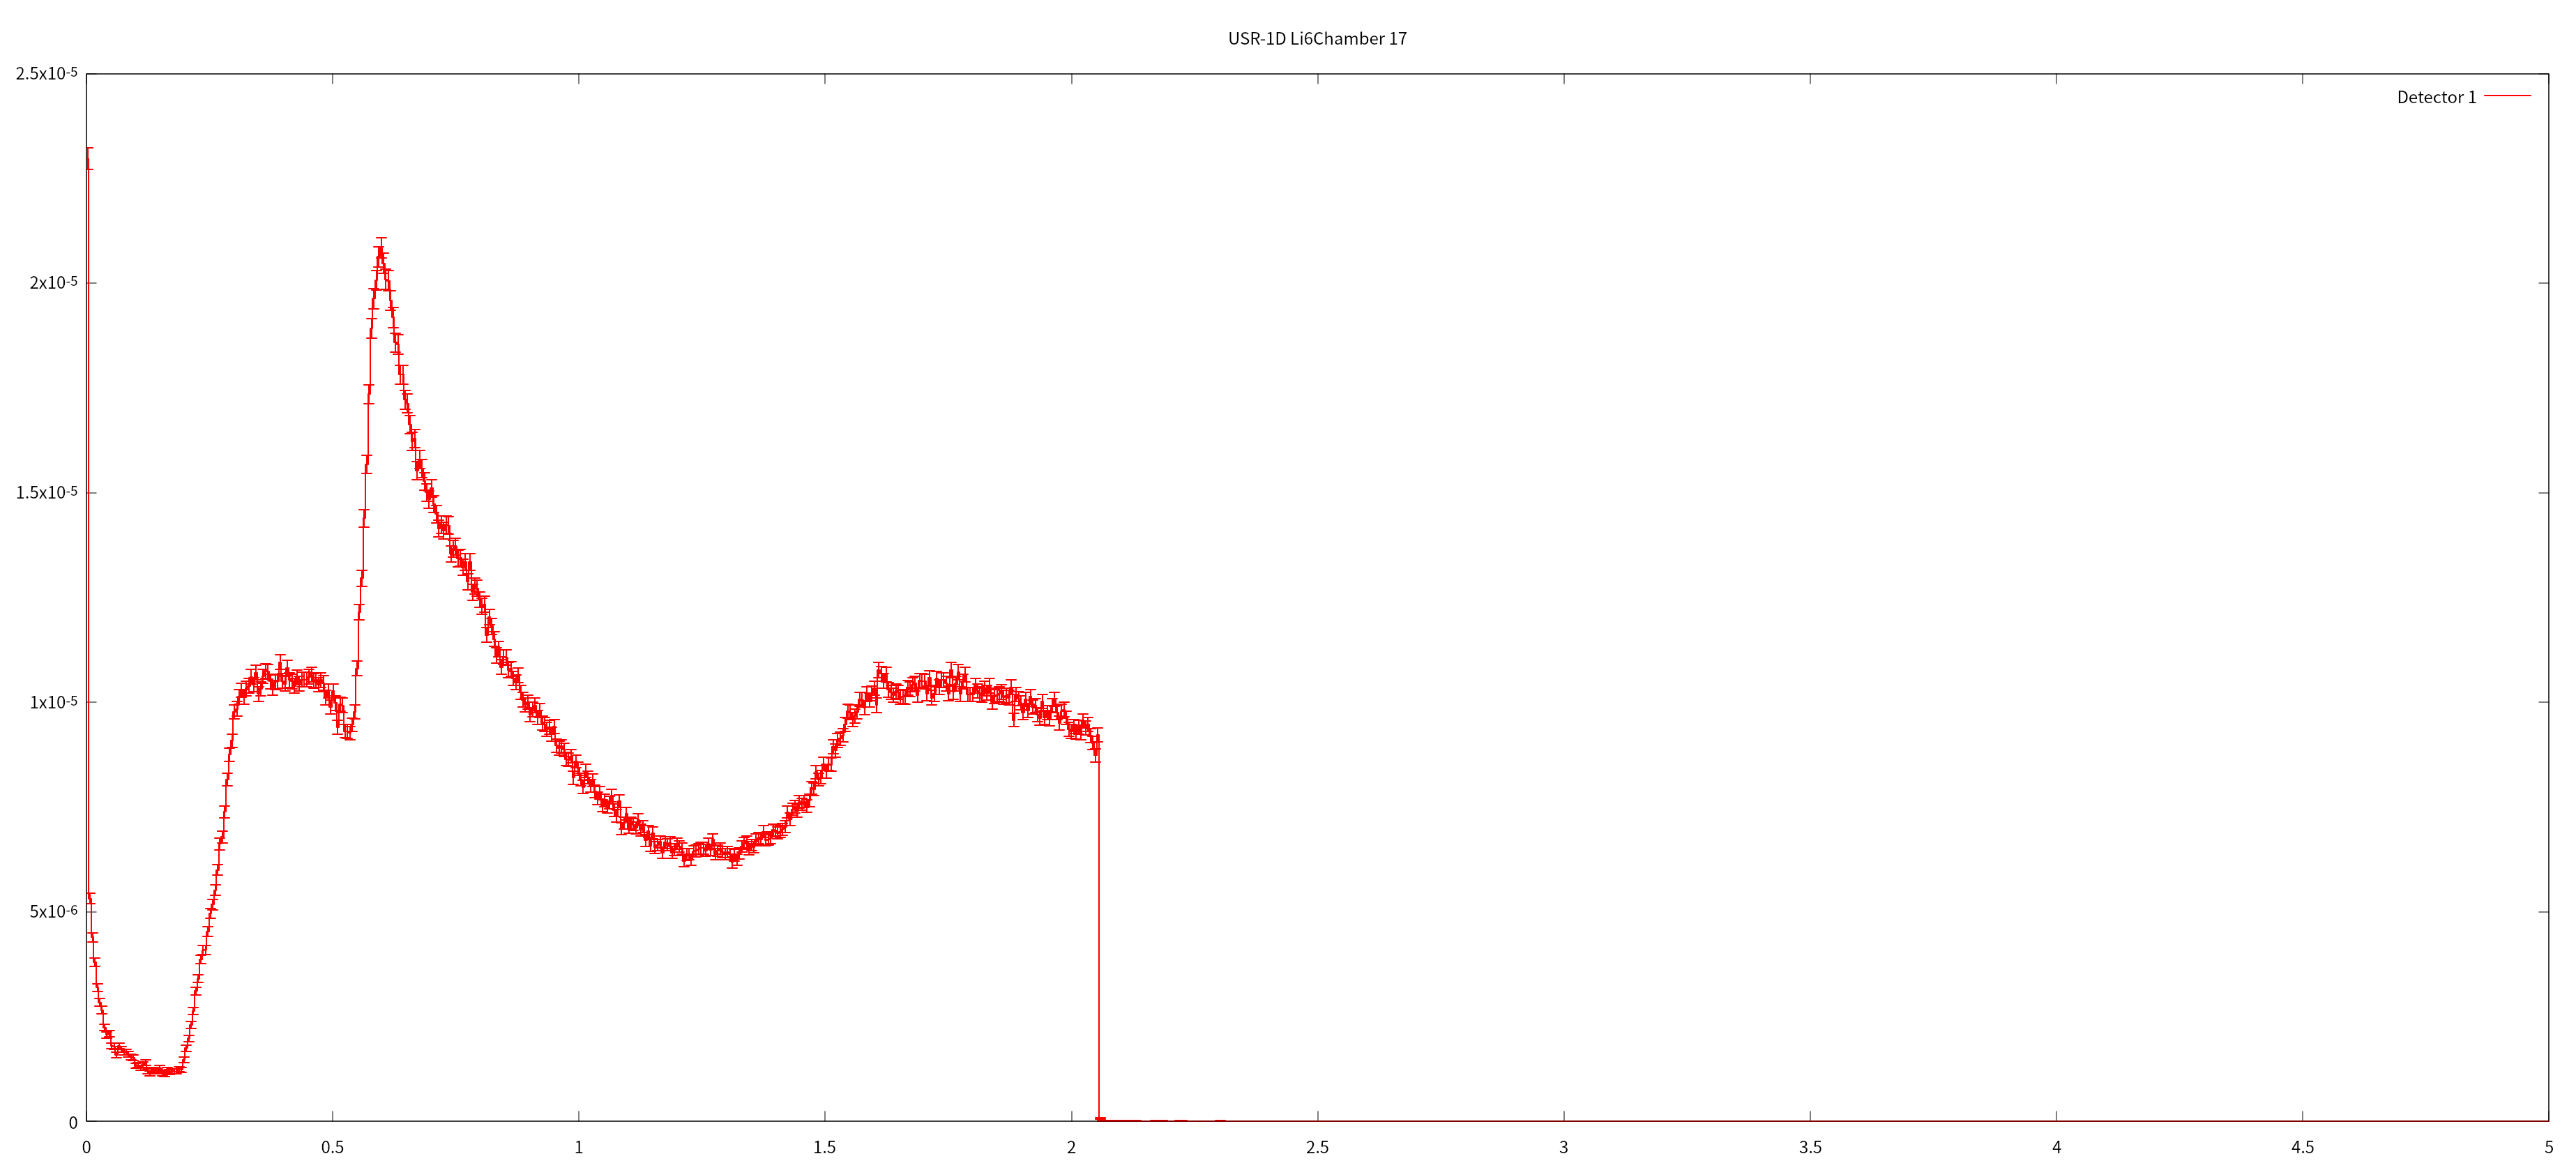
The pulse amplitude spectrum in lithium 6 chamber was calculated using Phits, Mcnp6 and Fluka, here is
the results:
The result from Fluka has large probability of little energy deposition in lithium 6 chamber,
What is the reason for it?
The pulse amplitude spectrum in lithium 6 chamber was calculated using Phits, Mcnp6 and Fluka, here is
the results:
Dear @Newconcept_1979 ,
Once again:
If that’s not the case, please provide the Flair project file so we can investigate the issue further.
Cheers,
David
@horvathd ,in this application, Setting the detector region as a trigger as well in coincidence with itself already was used. if not, the sum of probability of energy deposition in lithium 6 chamber is 1.
Dear @Newconcept_1979 ,
For the trigger, you need to set the cut-off energy (Ecut) to a small value as well.
Cheers,
David
@horvathd , of course, Scoring deposited energy larger than some value will cause 0 probability in these channels with their energy less than the setting value, but it is not the real physics.
@horvathd , maybe you are right, but what cause the little deposited energy?
Dear @Newconcept_1979
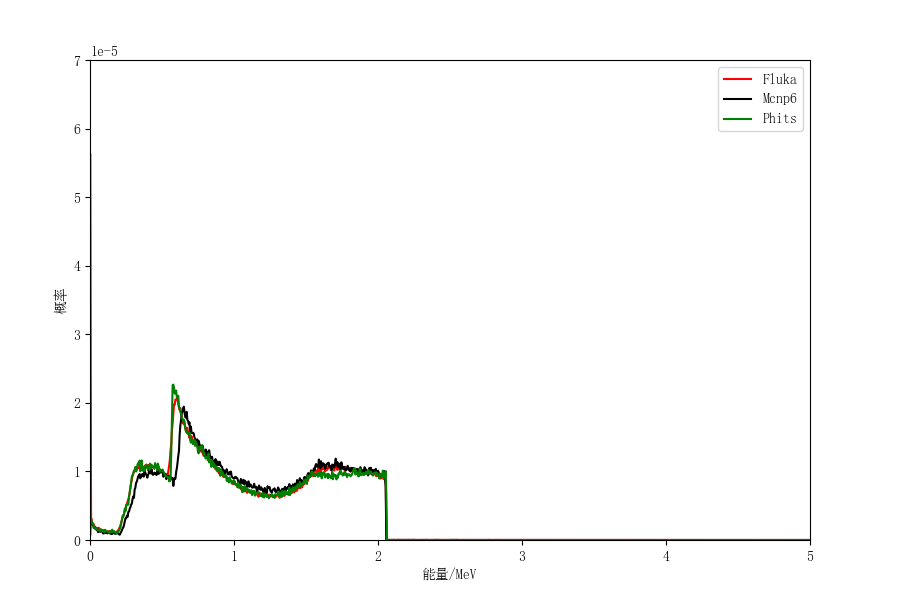
As can be seen in the plot in your initial post, all three codes you compare have basically the same probability of zero energy deposition in the active volume, since they basically have the same probability of non-zero deposition. If the other codes for some reason (either by user choice or by construction) do not record zero values in the first bin, that is purely technical. @horvathd has already explained a way to prevent this if you want, although I personally prefer to have that information in my histograms; in practice, just from the value of the first bin you can extract a good estimate of your detector efficiency.
Without having looked at your input, the main reasons why many events lead to zero energy deposition will have largely to do with geometry (many beam particles may not reach the Li target), cross-section (not all beam particles will interact) and self-absorption (some reaction products will not exit the Li layer and enter the gas to deposit energy).
Dear @Newconcept_1979
There seems to be a persistent misunderstanding, namely that FLUKA is giving you a much higher probability of zero energy deposition compared with the other two codes you used. This is not the case. If you look at the plot in your original post, you will see that the energy deposition spectrum in the three codes is virtually the same, meaning that the probability of non-zero deposition is also virtually the same. Therefore, the probability of zero deposition must also be the same in all three.
The way your input is set up, FLUKA assigns all zero values to the first bin in the histogram, hence the high value you observe in this bin. Why is this not happening in the other codes? Either because by construction the first bin of the histogram does not include zero (which you can also achieve in FLUKA as explained by @horvathd ), or perhaps because they ignore zero values by design when filling the histogram.
As for the reasons why a significant fraction of events does not lead to energy deposition in the detector volume, see my previous post. But it is important to understand that this seems to be happening in the same way in all three codes.
(The small differences in the three spectra can indeed be attributed to differences in cross-sections, nuclear data and stopping power values, and of course code implementation of relevant physical processes.)
Dear @Newconcept_1979
The time may have come to share your input so that we can take a look and understand your problem, and see which of the changes suggested by @horvathd are implemented and how.
@horvathd @atsingan , when the comment of Detect card is:
when the comment of Detect card is:
when the comment of Detect card is:
Dear @Newconcept_1979
Thanks for privately sharing your input.
First, a comment on your source routine. It describes a monoenergetic annular neutron beam emitted parallel to the z-axis that can be easily accomplished via BEAM and BEAMPOS cards. You can look for the relevant options in Flair, in the manual and in the relevant lecture from the latest course. In any case, the routine works.
On the contrary, your comscw routine has two important problems. First, it does not modify the COMSCW factor, therefore it has no effect whatsoever. Second, the condition (JTRACK.NE.-6.OR.JTRACK.NE.-4) will always be true, even when when the particle is either an alpha or a triton. You need to change .OR. to .AND. and then set COMSCW = ZERZER under this condition in order to only score contributions from these two types of particles.
You then correctly lower the transport threshold for all particles except neutrons to 1 keV via PART-THR, down from the 100 keV value defined via PRECISIOn DEFAULTs. You also completely DISCARD photons and electrons, but this is neither necessary nor advisable.
Having eliminated zero values by setting a very low non-zero lower bin limit in DETECT (e.g. 1.0E-12), and having a working comscw routine, you will see that the apparent problem is largely cured.
You will still note a small feature at about 4 keV. This is a hard limit for the α-particle transport threshold (relevant here), somewhat in conflict with relevant documentation which implies a 1 keV threshold is achievable. In all cases, keep in mind that histogram values below the transport threshold should be treated as unreliable. (If you do not reduce thresholds at all, leaving them at 100 keV, you will observe some even more dramatic artefacts.)
In any case, this lowest part of the spectrum would in real life be dominated by electronic noise and energy deposition from other particles, mostly photons.
As a further moral to this story, we once again reiterate that the most meaningful and prompt assistance can be provided when input files and relevant routines are supplied from the start. In this case, the use of routines filtering the scoring and the discarding of particles, while critical to properly interpret the results, were not mentioned, wasting time that could be put to better use.
@atsingan , sorry for delay reply because of the Spring Festival,
Only the deposited energy by alpha and or triton is tallied,
so the question still is what cause to high tally on the lowest part of the spectrum?
Dear @Newconcept_1979
I will have to assume that you implemented all the changes suggested above. If so, what remains should be the (relatively small) feature mentioned in my previous post:
I can only repeat that results below the relevant transport threshold (here 4 keV for alphas) are meaningless.
On your points 1 and 2 there is little disagreement, but neither has any bearing on the question.