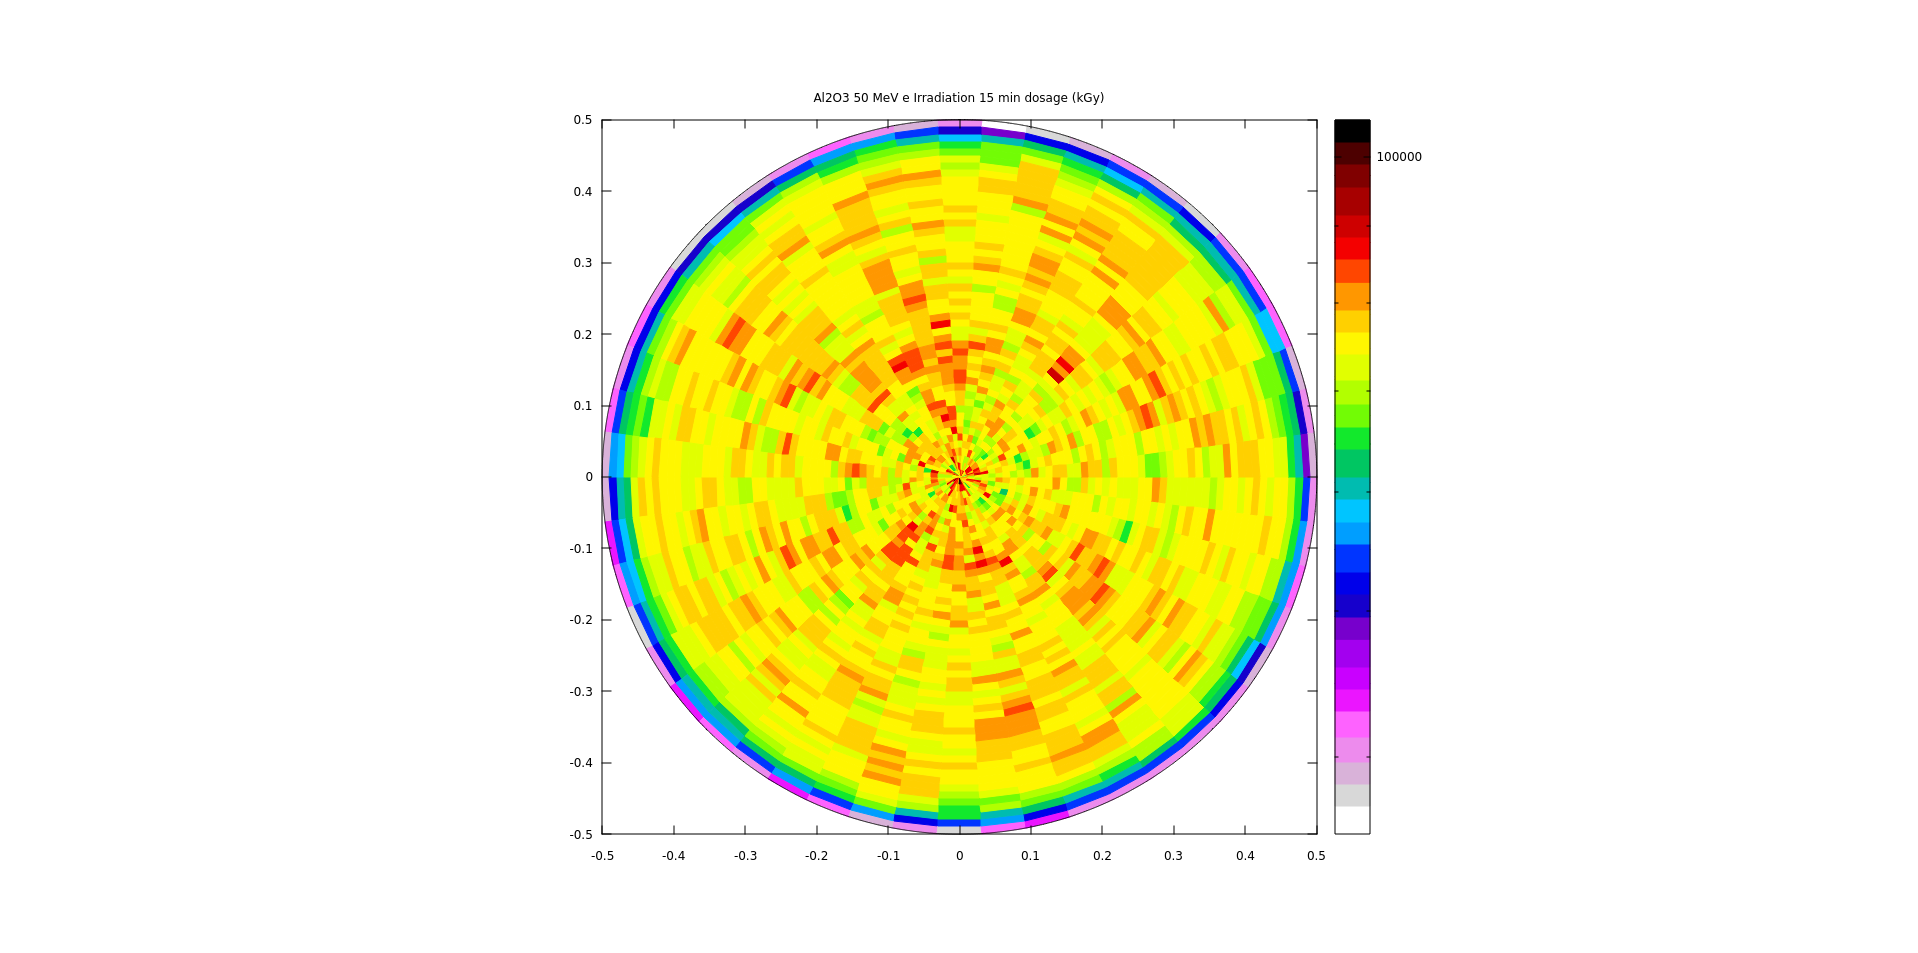
Hi @ceruttif when I plot with more statistics, I am losing the markings on the colour axis. How do I correct this?
Dear @cbaldwin,
most probably (I need to see your .flair file to be sure) your tics disappears because a tics interval value cannot be calculated automatically for the color bar range that is currently set by the user or determined by the default.
Typically, you can solve the problem by adjusting the range according to your statistics, or set intervals manually using the gnuplot command "set cbtics ". See a similar xtics command for the syntax:
Can you please share your .flair file, in the case if proposed solution will not help?
Kind regards,
Illia