Dear Dávid,
thank you very much for your previous answer.
I have another question regarding the same input I uploaded.
I am currently simulating the LET spectrum of recoil protons produced by the interaction of neutrons emitted from an AmBe or Cf sources within a polyamide converter. I am scoring this spectrum at the boundary between the converter and a second region made of PADC. However, I have observed an unexpected dip in the spectrum, which I was not expecting.

I’d like also to clarify the meaning of WHAT(6) ‘mat’ in the USRYIELD scoring card. From what I understand, this should be the material of the region where the protons enter and where LET is being evaluated. Is this interpretation correct?
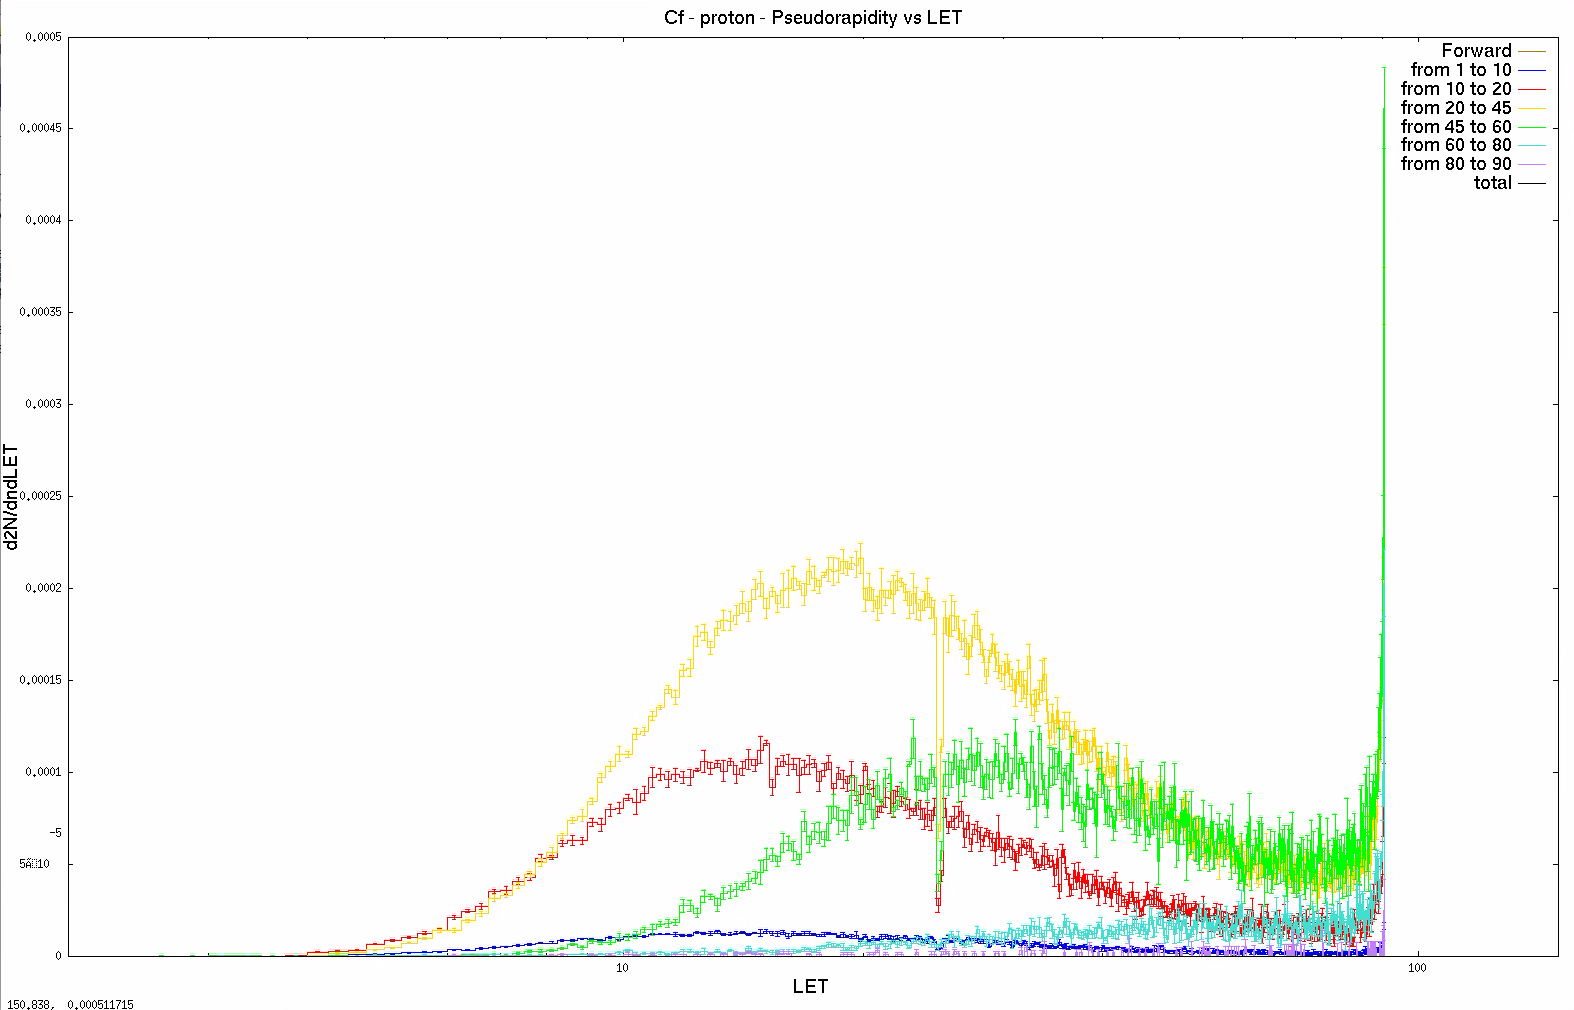
To further analyze the behavior of the spectrum, I have extended my input by including a set of USRYIELD cards to study the dependence of the spectrum on the protons’angle with respect to the beam axis. I used the pseudorapidity lab. as first variable and LET (or energy) as second. However, when I plot the spectra obtained for different pseudorapidity intervals and then compare them to the total spectrum (integrating over pseudorapidity from 0 to infinity), I notice an inconsistency: the total spectrum has a very different scale on the y-axis, way much smaller.
I suspect this discrepancy is related to a normalization factor, but I have not found sufficient documentation on this. I also noticed that during the FLUKA Advanced Course, the slides on scoring mention paying attention to this factor, but without further explanation of its meaning or implications.
Here above you can see the different spectra and the total one is missing since the y scale is of the order of 10^-10 (see first picture)
Thank you very much for your support!
Cheers,
Antonella
problem.flair (41.1 KB)
problem.inp (7.2 KB)