Dear experts,
I am using x-rays of various energies, each with a specific spectrum from a betatron, or a LINAC to image some objects. I use pixelated USRBIN detector to record the PHOTONs. The idea is to look at the x-ray attenuation variation for different energy spectrums from the betatron and LINACs, and from that to get an idea about the materials being imaged.
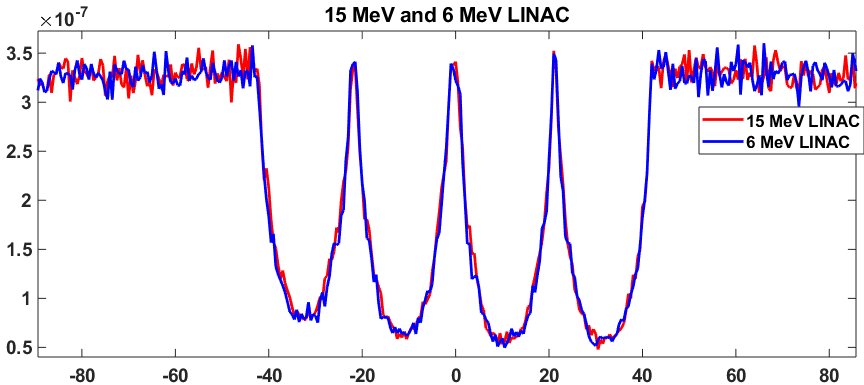
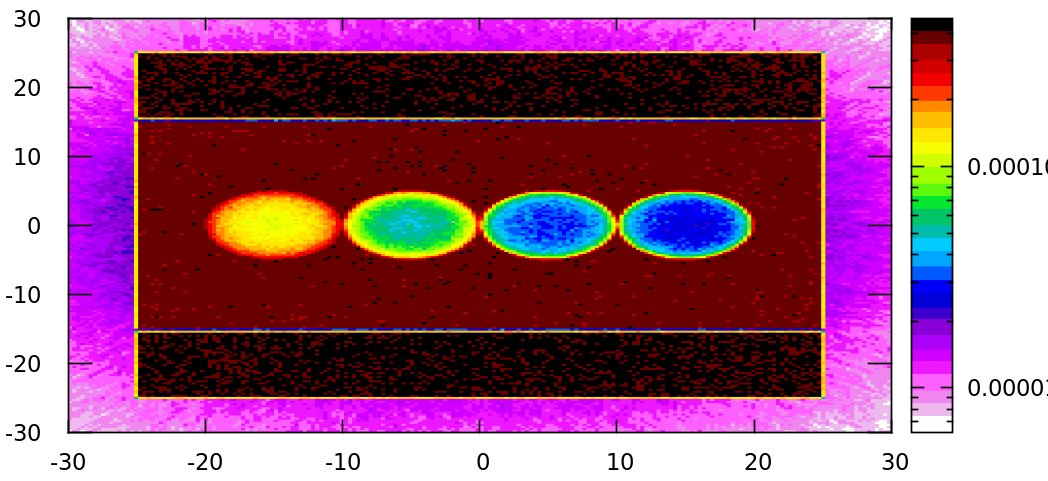
When I plot the data file from the simulation, I notice that each energy shows exactly the same attenuation which is not very useful. This is perhaps because of the normalization done by FLUKA? Please see the images attached. The 2D image shows the 4 metal spheres of varying density being imaged and makes perfect sense. The graphs shows the x-ray attenuation because of these spheres but for, 2 different energy spectrum (6 MeV and 15 MeV LINACs). Although the spectrums have some overlap, I would expect some serious differences on the attenuation.
Can the experts comment on what exactly is the reason for such similar attenuation profile? If it is done by FLUKA, what is the solution? Should I record ENERGY instead of PHOTONS? But how do I know that the normalization is not done for ENERGY as well and I will not see the same profile?
I will take a look to it very soon. Probably I will need your input file + auxiliary files/routines so in case you can already provide them it may speed up the process.
The normalization performed by FLUKA should not be responsible for the issue you are encountering. To be able to provide a solution I would need the means to reproduce your results, as anticipated in my previous message.
I looked at your files and I believe your results make sense. Indeed, a difference in attenuation is to be expected, but your method does not allow for a proper visualisation. A combination of two factors explains what you reported:
Your materials are heavy or very heavy (Cu, Pb, W and U). As a result, only a small fraction of the X-rays make it through them. This makes difficult to observe differences in attenuation.
It gets worse because of your spherical regions and the projection used to get the attenuation profile you shared above. Most probably your projection is not restricted to those bins along the centre of your spheres, but you are adding photons that did not pass through the spheres (but around them) to the tiny quantity that manages to go through them (see previous comment). Therefore, changes in that tiny quantity are difficult to visualise. Better statistics and logarithmic scale may help, but the solution would be to define a proper projection and/or change for a better setup.
In order to check by yourself, you can do the following:
Try with lighter materials (e.g. water): the difference in attenuation for both energies will be much clearer.
Restrict your projection to those bins across the centre of your spheres. Consider using cubes or similar instead of spheres so you can make a cleaner projection, at least until you fully understand the issue.
Finally, few comments about your inputs that may be of help:
Be careful with the ASSIGNMA card. I have seen one with an empty “Reg” field. By default, FLUKA will assign that material to the 2nd region of your geometry, VOID in your case, which would mess up your calculation ( WHAT(2) explanation in ASSIGNMAt | FLUKA).
When using a source routine, select a beam energy in the BEAM card above the maximum energy you will use in the routine (note 3 in SOURCE | FLUKA).
You are using a huge number of bins in your USRBINs. This will only consume memory and make things slower. Consider reducing them according to your needs.
Your beam definition is suboptimal. Using a fully isotropic source, you are spending a considerable amount of time sampling, simulating and scoring photons that will never reach your spheres. To avoid this, you can restrict the photon sampling to those directed towards your area of interest.
Hi Francisco,
Thanks a lot for your reply. You have pointed out few very important points. Some of those are in our radar already. However, as you can see, we do notice some differences on the attenuation (for example) by Cu vs W, or U in the same LINAC energies. However, when comparing the same set with the data from a different LINAC, the difference is not detectable! This does not makes sense. May be there is some normalization taking place as it is suggested here: EVENTBIN | FLUKA. Following that “discovery” on EVENTBIN, I did some research and looks like EVENTBIN might be better suited for my purpose. However, the result I am getting from EVENTBIN card is very difficult to handle. In the ASCII mode, or in binary format, it is difficult to read them with a third-party software.
Please note, that the these routines are just a template, you need to implement your scoring logic by yourself to make them useful.
However, I don’t see how an event-by-event type scoring would by useful in your simulation. Also, it is highly unlikely that there is a problem in FLUKA’s built-in scorings.
My previous reply was addressing exactly this issue. Please give it a try to what I suggested above, you only need to change a material and maybe the USRBIN definition. You will see that there is no problem with FLUKA normalization. The difference in attenuation for both energies will be obvious to you. If it is not, please come back to us providing details on how do you create the attenuation profile.
Hi Francisco,
Problem solved. It was actually a small typo on my Matlab script that was causing all the problems. All issues are solved now. The difference between 1 MeV, 6 MeV and 15 MeV x-ray attenuation is clear.
Thanks again for your kind help and having a closer look on the issue.