Using scintillators to study the lifetime of muons

Versions

FLUKA: FLUKA 4-5.0
Flair: FLAIR 3.4-2

Description

Dear FLUKA experts
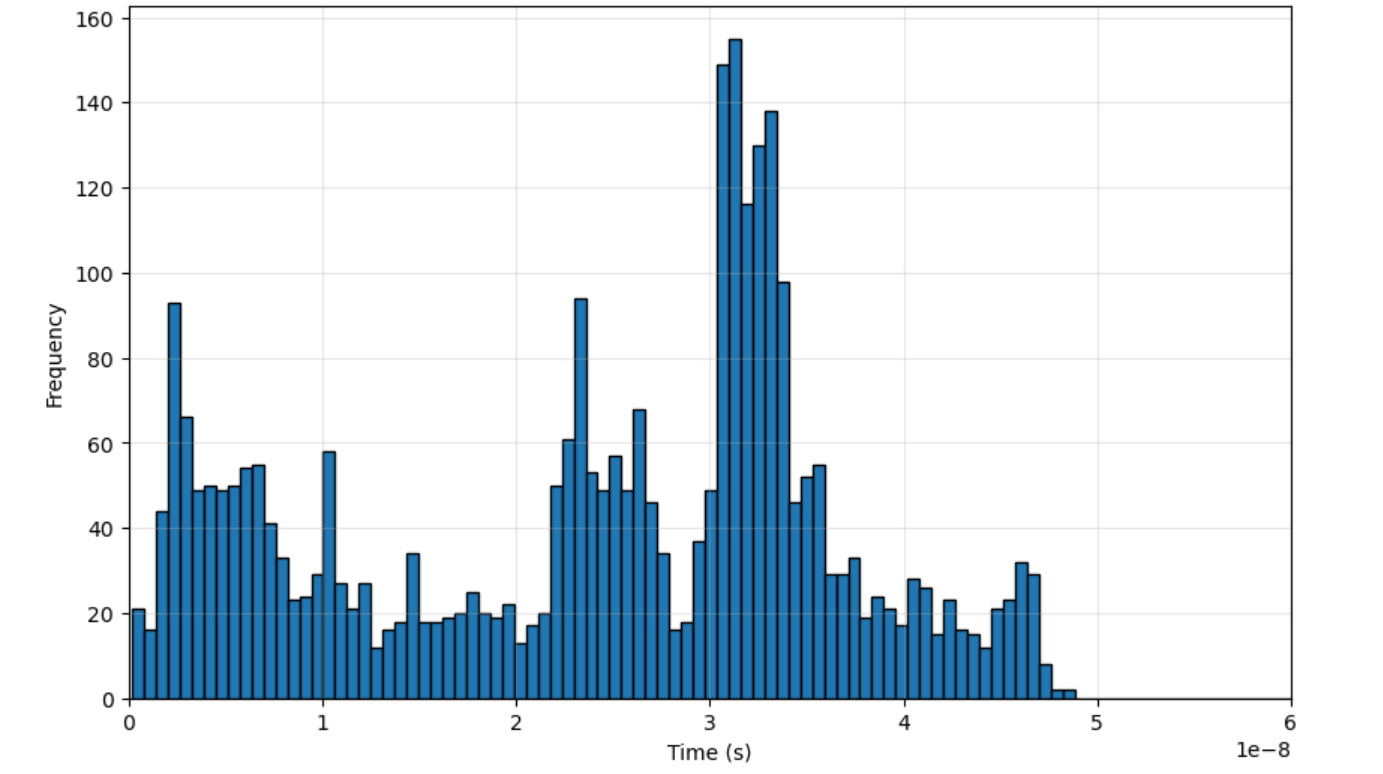
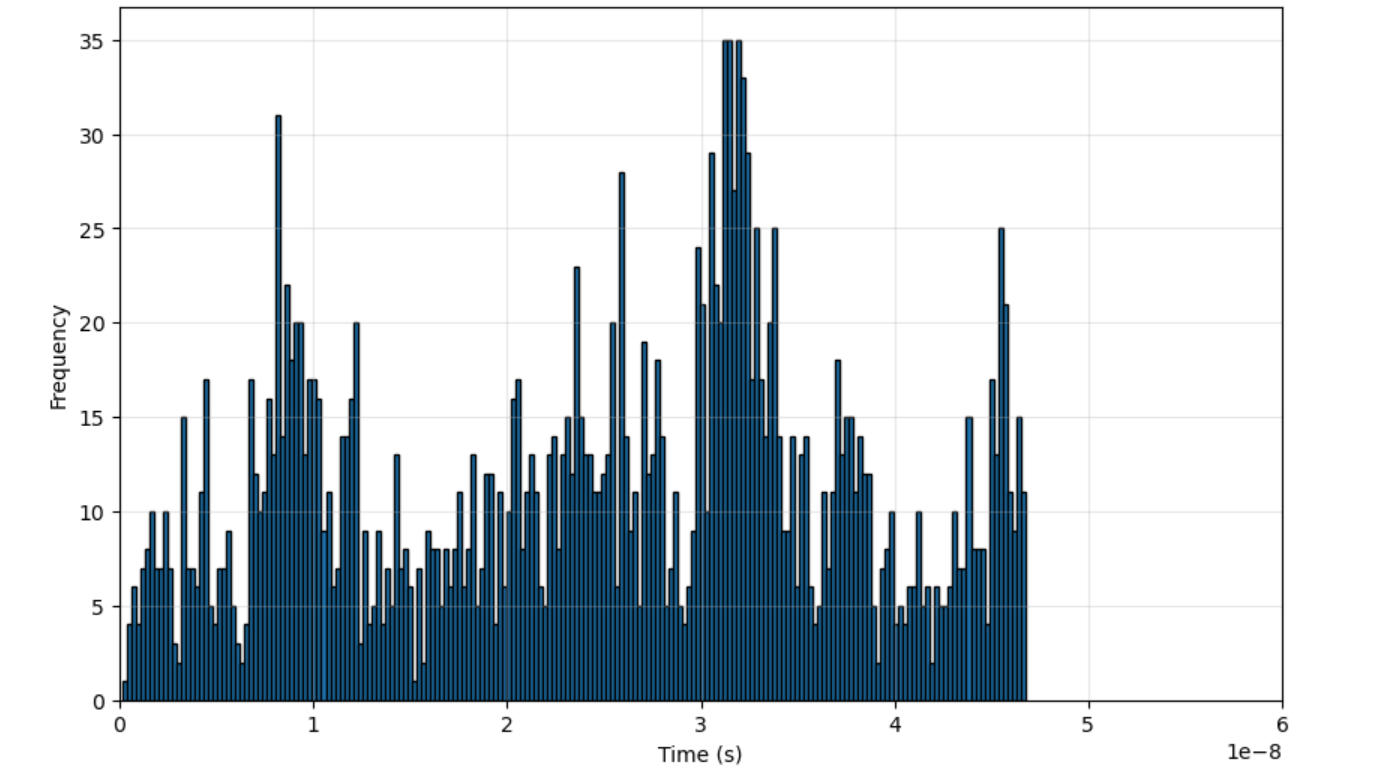
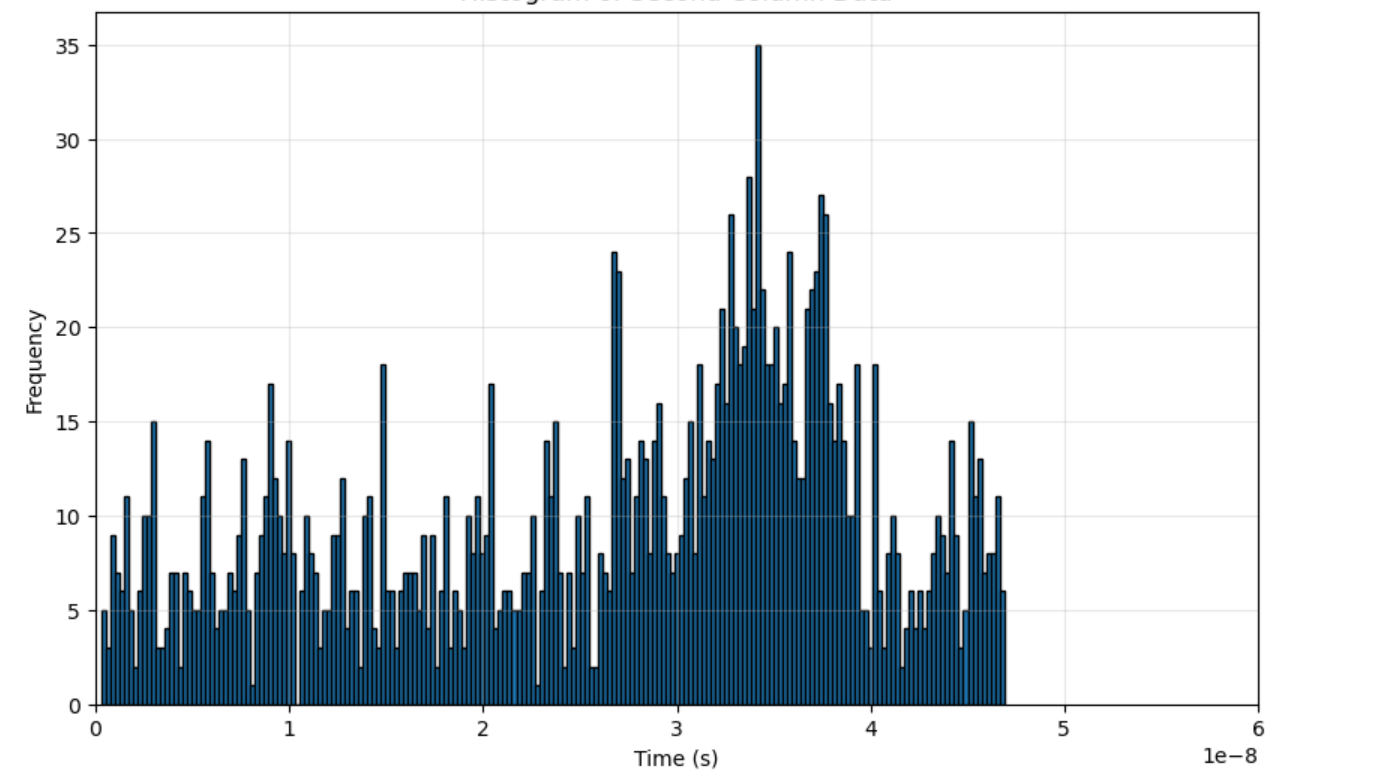
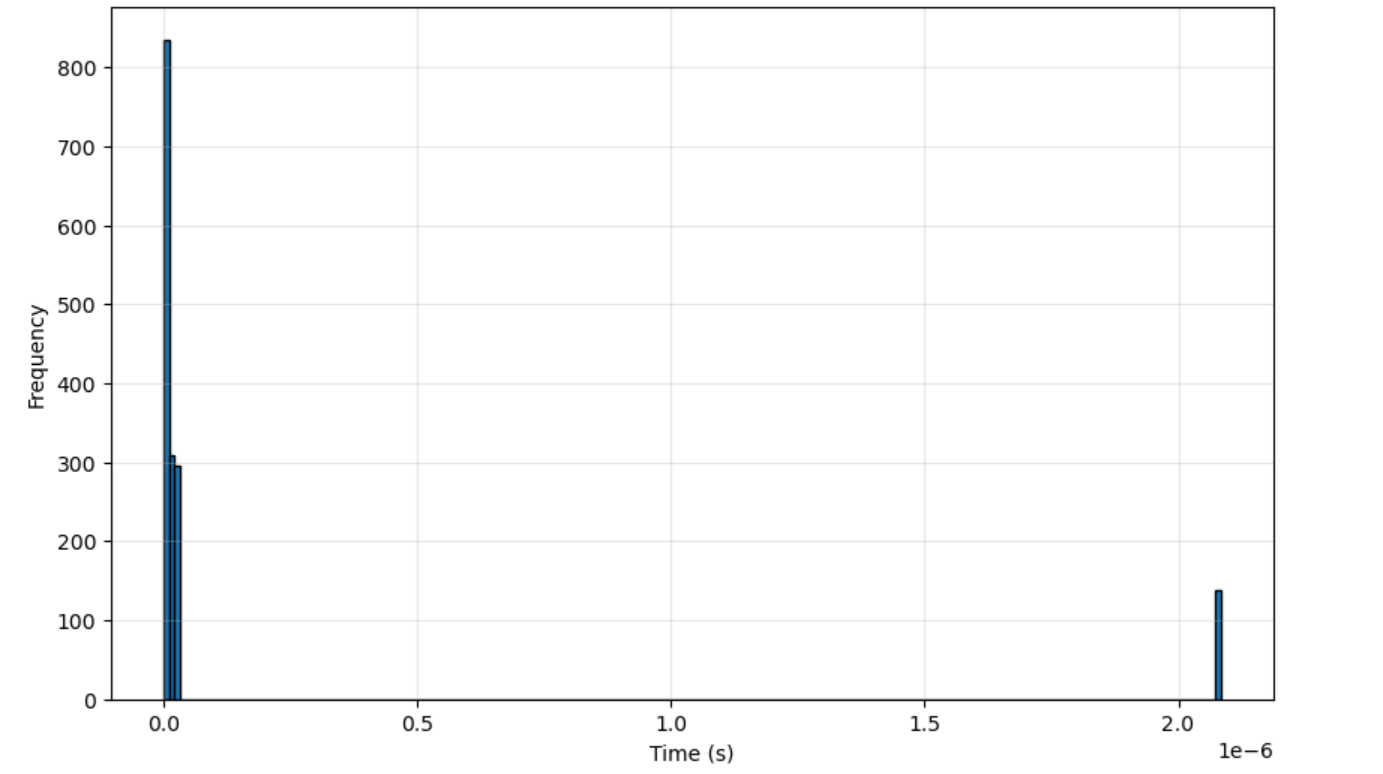
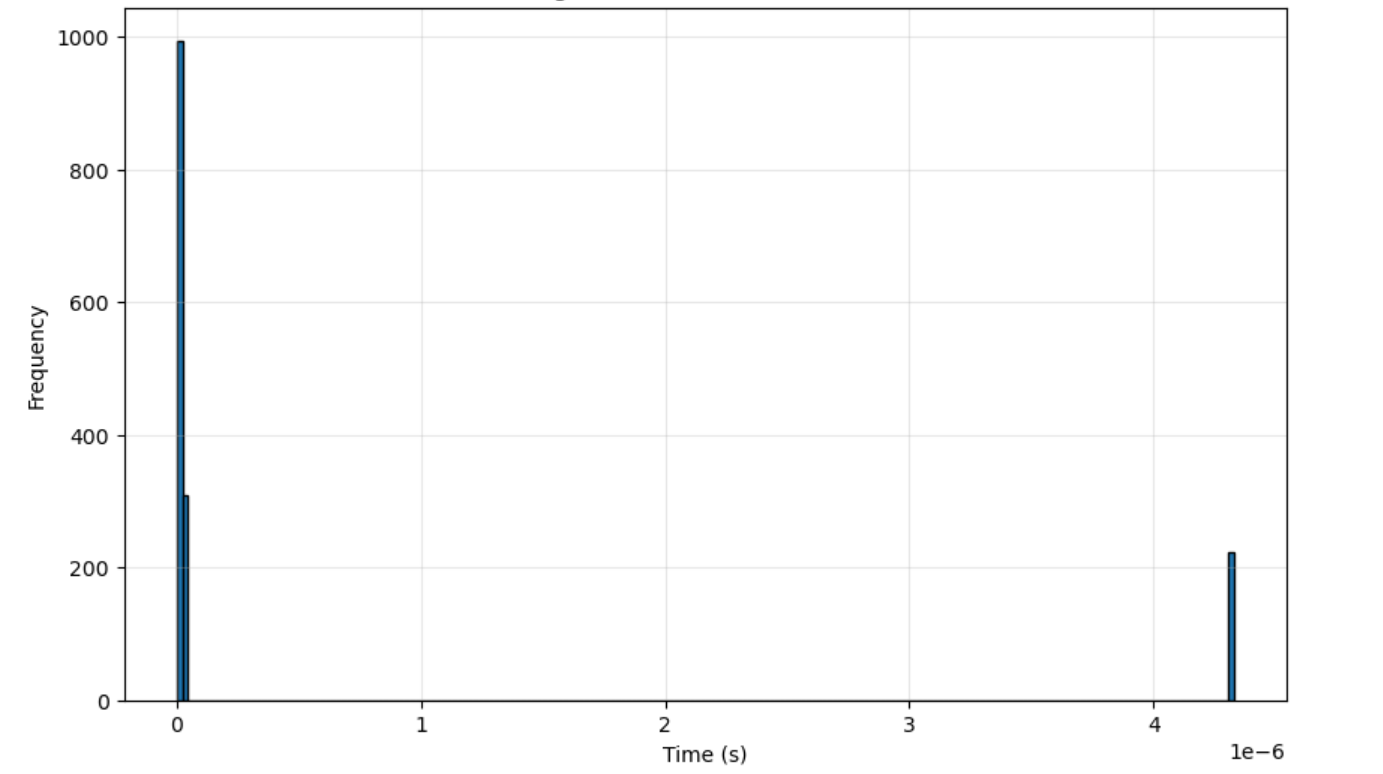
Now, I am attempting to use FLUKA to measure the lifetime of muons: a muon beam is transported into an EJ-200 scintillator, where it subsequently decays into an electron.

In a real experiment, this generates two light signals (effectively two energy depositions). The time difference between these two signals is then statistically analyzed to ultimately calculate the lifetime.

Now, I want to ask: Can I statistically record the time difference between these two events and thereby determine the lifetime? If so, how can I do it?

And I also want to know what the initial setting for the lifetime of muon particles is in FLUKA.

I have uploaded the .inp and hope you can help me resolve the issues. I would be grateful.

Best
Yongce,

FLUKA_geometry_forask.inp (1.8 KB)

Input files

Hello Yongce,

sorry for the delay.

The answer is of course yes, this can be modeled in FLUKA, although it will require some post-processing on your end to extract the signal.

The way you achieve your goal is the following:

  1. Use a custom mgdraw.f, specifically modifying the ENDRAW entry, which is called any time an energy deposition takes place, and write to a file this information:
      ENTRY ENDRAW ( ICODE, MREG, RULL, XSCO, YSCO, ZSCO )

        WRITE (99,*) "track", JTRACK, RULL, ICODE, ATRACK

      RETURN

which is writing:

  • JTRACK: particle type (not so important in this case, but good to keep track)
  • RULL: energy deposited GeV
  • ICODE: energy deposition code (see the file to see the meaning of the codes)
  • ATRACK time at which the deposition occurred, in seconds

if you would also like to keep track of the history, you can print NCASE as well, but in theory you don’t need to.

Make sure to also activate the user routine by adding a USERDUMP card in your input file, specifying that you want to call a user defined routine, as well as compiling and using the executable correctly.

  1. In a post-processing script, you can parse this file and associate energy depositions to timing. For example, you can use python to create a data-frame (with pandas, perhaps) with the values you printed. See below notes for the best way to treat multiple contributions to the same scintillation event. A very crude approach would be to define time cutoffs:
    a) short time (few nanosecond scale, for the prompt signal, must be adapted to your own simulation to see that you see the full prompt energy deposition peak)
    b) delayed time (~100s of ns, according to the muon lifetime)
    c) global time (few us, the coincidence window of your setup)
    as well as energy threshold etc to clean up the signal. You can then find the average time of the signal within the two time windows (a->b and b->c), and find the difference. A better approach would be to mirror in the analysis performed in the experiment, as I briefly note below
  2. The muon lifetime (at rest!) in FLUKA is the well known value of ~2.2us.

Some notes:

  • in general, we don’t have a simple picture of: muon energy deposition → decay → electron energy deposition. The muon/electrons can knock delta rays, which means that there will be several contributions to the same scintillation event. You can play with delta-ray thresholds (without blowing up the size of the mgdraw file!!) or somehow combine signals with a time resolution to form single light peaks.
  • muon decay is not the only mechanism present, it competes with muon-capture (analog to electron capture). This mechanism scales very strongly with the atomic number. For a plastic scintillator the Z is quite low, so muon decay dominates, but don’t expect a 100% rate of muon decay, some will be absorbed.

Hope this helps,

Stefano

Dear Stefano Marin
Thank you for the reminder. I have now written an ENDRAW card, as shown below.
INTEGER IODUMP
PARAMETER ( IODUMP = 10 )
LOGICAL LOPEN
SAVE LOPEN
DATA LOPEN /.FALSE./

CHARACTER*8 NAMREG
INTEGER IERR1
ENTRY ENDRAW ( ICODE, MREG, RULL, XSCO, YSCO, ZSCO )

IF ( .NOT. LOPEN ) THEN
OPEN ( UNIT=IODUMP, FILE=‘detector_hits.dat’,
& STATUS=‘UNKNOWN’, FORM=‘FORMATTED’ )
LOPEN = .TRUE.
END IF

CALL GEOR2N ( MREG, NAMREG, IERR1 )
IF ( NAMREG .EQ. ‘BOX’ ) THEN
WRITE ( IODUMP, 1000 ) NCASE, ATRACK, JTRACK, ICODE,
& RULL, XSCO, YSCO, ZSCO
END IF

RETURN

1000 FORMAT( I10,1X,1P,E16.8,1X,I6,1X,I6,1X,1P,E12.5,
& 3(1X,1P,E12.5) )

FLUKA_geometry.inp (2.4 KB)

However, the resulting data file, detector_hits.dat, is empty after the run. I’m not sure where I went wrong (the mgdraw.f file was successfully compiled and linked). I am also providing you with my inp file.

Additionally, I have a new question: Do I need to include OPT-PROP and OPT-PROD cards in the inp file? This simulation involves scintillation light, but my focus is on energy deposition.

Best
Yongce Gong

Hello Yongce,

i see a few issues:

  1. First a clarification, this ENDRAW you wrote is inside the mgdraw.f in the user files? I would keep it much simpler than that. On my end the one that you sent does not compile (it could also be the way you attached it here on the forum). Also, output units < 20 are reserved by FLUKA, so you cannot use 10.

I would only add this one line in ENDRAW:

      ENTRY ENDRAW ( ICODE, MREG, RULL, XSCO, YSCO, ZSCO )


      WRITE (99,*) "track",JTRACK,RULL,ICODE,ATRACK,MREG,XSCO,YSCO,ZSCO

      RETURN

and everything else you can do in post-processing.

  1. Are you sure you want to simulate 300 TeV muons?

  2. it would benefit later if you added delta-ray cuts, so you can regulate the amount of data written.

  3. I would start without the optical photons completely, and just use the time of the energy depositions as the time of scinitillation. In a more advanced simulation, you can re-introduce this, but be careful as to not write too much to the file. So for now, remove all cards related to optical photons.

please let me know if you can see an output in the file ending in *_fort.99

Stefano

Dear Stefano Marin

Now I have changed the ENDRAW, and I have changed inp file (Becasue muons energy is too high).
and yes I get some result (I upload the inp file and .dat file). I dont know this is wrong or right. Can you check it?

and ENDRAW code:
ENTRY ENDRAW ( ICODE, MREG, RULL, XSCO, YSCO, ZSCO )

IF (JTRACK .EQ. -1) RETURN

IF (.NOT.LOPEN) THEN
OPEN(UNIT=99, FILE=‘mgdraw_do.dat’, STATUS=‘UNKNOWN’)
LOPEN = .TRUE.
END IF

CALL GEOR2N(MREG, NAMREG, IERR1)
IF (NAMREG .EQ. ‘Box’) THEN
WRITE (99,*) ‘track’, NCASE, JTRACK, RULL, ICODE, ATRACK, MREG,
& XSCO, YSCO, ZSCO
END IF

FLUKA_geometry.inp (2.5 KB)

FLUKA_geometry001_mgdraw_do.dat (4.9 MB)

Dear Stefano Marin

I have updated my work. I used the ENDRAW code below, and it seems to run correctly in my opinion. I also obtained the mgdraw_do.dat file. After analyzing the data, I found that under each ncase, the distribution of the time at which energy deposition occurs is within tens of nanoseconds. I have uploaded the energy deposition time distribution plots for several ncases. I believe this result may not be entirely correct, but I am unsure where I went wrong.

      LOGICAL LOPEN
      SAVE    LOPEN
      DATA    LOPEN /.FALSE./


  ENTRY ENDRAW ( ICODE, MREG, RULL, XSCO, YSCO, ZSCO )


  IF (.NOT.LOPEN) THEN
     OPEN(UNIT=99, FILE='mgdraw_do.dat', STATUS='UNKNOWN')
     LOPEN = .TRUE.
  END IF

  CALL GEOR2N(MREG, NAMREG, IERR1)
  IF (NAMREG .EQ. 'Box') THEN
     WRITE (99,*) NCASE, ATRACK, J0TRCK, JTRACK, RULL, ICODE, MREG,
 &              NAMREG, XSCO, YSCO, ZSCO
  END IF

FLUKA_geometry.inp (2.5 KB)

pls share your mgdraw file and steps followed by you for its compilation?

Hello Yongce,

the issue is that you don’t have enough material to stop 5 GeV muons, so they don’t decay inside the scintillator. Try increasing the depth of the scintillator, or reducing the energy of the muons.

Stefano

1 Like

Hello, Deepak Akar, of course, I can provide the .f .inp file. You can see that in the attach file.

and run command:
$FLUPRO/bin/fff mgdraw.f

$FLUPRO/bin/lfluka -m fluka -o myfluka mgdraw.o
$FLUPRO/bin/rfluka -e myfluka -N0 -M1 FLUKA_geometry.inp

mgdraw.f (15.3 KB)

FLUKA_geometry.inp (2.2 KB)

Hello Stefano Marin, Actually, my scintillator model already has a thickness of nearly 1.35 meters! Meanwhile, using the USDRAW module, I recorded that nearly half of the muon decay products generated neutrinos. I can share the USDRAW content with you if needed. However, I believe the issue still lies with the ENDRAW part.

Hello Yongce,

Actually you have much more than 1.35, closer to ~14 m of scintillators in fact, and yet this is not enough to stop 5 GeV muons. At these relativistic energies and with a material of density ~1, muons lose approximately ~2 MeV/cm, meaning that linearly it would take 25 m of material to stop them (this is reduced a bit by the fact that the stopping power increases as the muon loses energy, but it does not reduce it to the size of the scintillators you have). You might find this reference of interest pdg_review, specifically Fig 34.4 where you can see that the range of the muons is longer than your scintillator.

I have actually run your input for 2 GeV muons (which are indeed stopped within the scintillator) and clearly see two distinct groups of signals, one prompt (ns) and one delayed (us).

Stefano

1 Like

Hello, Stefano Marin
Thank you very much. When I changed the muon energy to 2 GeV, I observed two energy depositions as shown in the figure below. It looks very right.

However, I still have some questions regarding this model:

  1. Based on the figure, the prompt (ns) and delayed (μs) energy depositions appear to have a significant difference. Does this mean that the photons generated by the prompt energy deposition should theoretically be more numerous than those generated by the delayed energy deposition?

  2. I previously used a 4 cm thick EJ-200 scintillator coupled with a PMT connected to a DT5751 to record cosmic ray muon signals. I obtained some signal waveforms, as shown in the figure below. The horizontal axis represents the sampling points in nanoseconds, and the vertical axis represents the amplitude in ADC units. Below, you can see two types of signal waveforms. If the answer to the first question is correct, does that mean the first type of dual-waveform signal is accurate (where the first waveform with a larger ADC value corresponds to photons from the prompt energy deposition of the muon, and the second waveform with a smaller ADC value corresponds to photons from the delayed energy deposition)? As for the second type of waveform, does it indicate that two prompt energy depositions from muons were recorded within this time window?