Dear experts,
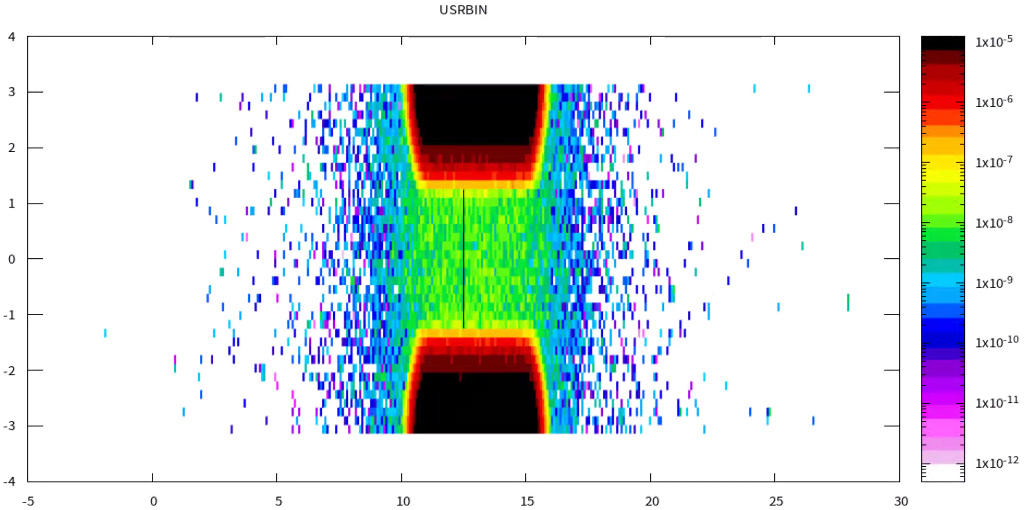
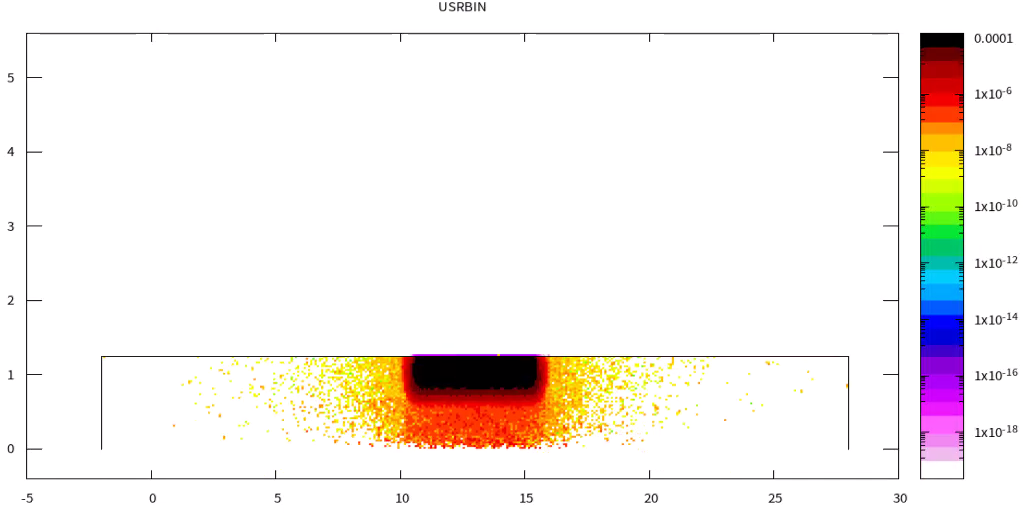
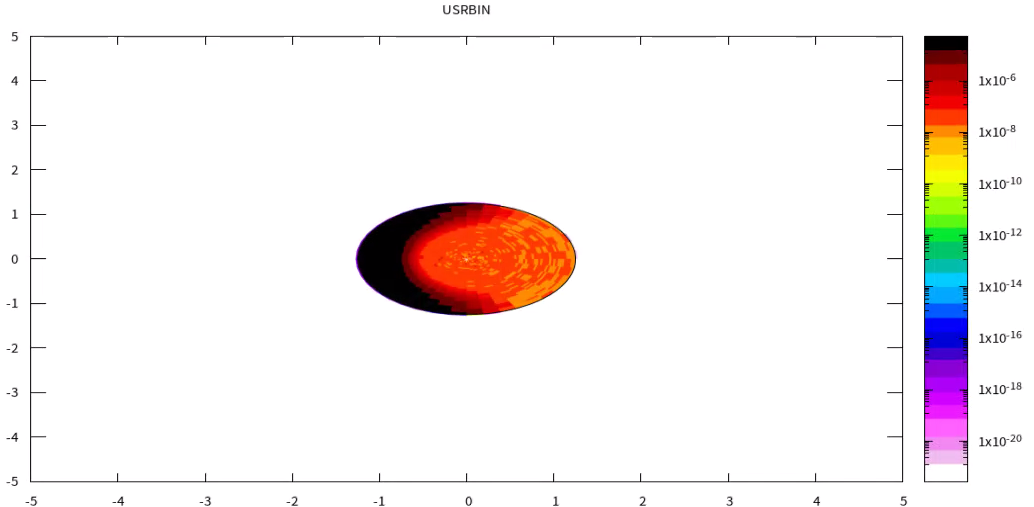
I am using USRBIN to score energy deposition of a cylindrical structure and get three plots as the following(projections on R,Φ,Z respectively):
Your interpretation is correct: e.g. in the z-projection, the values are the average along the z axis (here along the full length of your object). However, you can set specific limits for the coordinates in the Plot menu (Look for the “Projection and Limits” box), so you could generate the same plot taking only a slice along z, alowing you to scan different depths of the object.