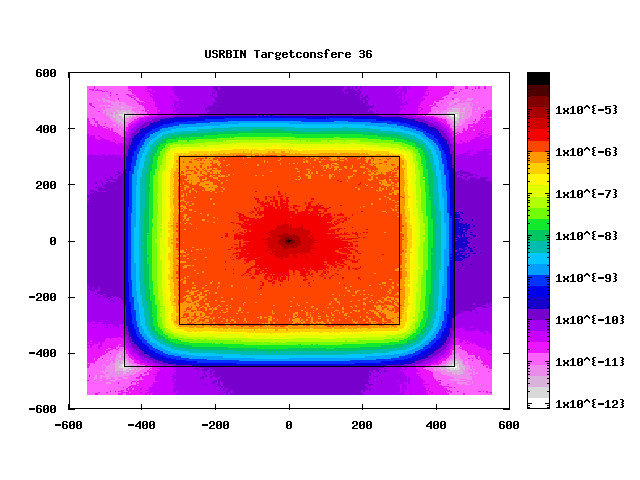
The image shows the radiation shielding of a Tc99m specimen irradiated through a proton beam. The shielding is carried out using a concrete wall. Using the USRBIN card we measure the environmental dose outside the concrete wall, which for the safety of any operators should be below a certain threshold. On the x-axis the distance from the center is represented while on the y-axis the environmental dose equivalent . In the analysis of this graph resulting from the simulation, 2 problems were found:
It is not possible to understand what the unit of measurement of the environmental dose equivalent is, it is essential to understand whether it is in mSv, Sv, pSv or in any other unit of measurement, but it is not possible to obtain any information.
Secondly we’d like to have a denser grid of values, having an order of magnitude of distance is too much -.If necessary, it would be convenient to have a more detailed table in front of the graph.
Would anyone be able to help me with these issues? Any help would be fundamental to the conclusion of the project so I strongly hope for your help.
Thank you very much in advance
In Fluka the unit of the dose equivalent in Fluka is “pSv”, this is noted in the Fluka Manual (Version 4-5.0, in chapter 5.3 Physical units). Aside the Fluka Manual, the official Fluka Course lecture slides are available to provide some guidence. The following link refers to an exercose of the last official Fluka course, where the dose equivalent rate around a target was calculated: https://indico.cern.ch/event/1498636/contributions/6486161/attachments/3069118/5429221/Ex_RP_calculations_2025_JRC.pdf On the timetable of the course (Fridays lecture & exercise on radiation protection) you can also find the corresponding .flair file. To my understanding, as the equivalent dose rate (“DOSE-EQ”) is given in pSv/(s*primary) you can normalize it to your source activity just by multiplying the initial value with your activity (in Bq). Regarding your second question, the Fluka Manual provides information on how to adapt the mesh density for Scoring in a desired resolution. You just have to increase the number of bins in the “USRBIN” scoring card or any other scoring card you might use. The scale of the graph is adapted in the “Plot” area postprocessing the results, here you can just type in min and max values for your axes (x, y and cb (for the colorful scale to the right of your plot). Note, that I am not a Fluka professional, but just a basic user, this answer is to my best knowledge, but may contain errors. Best Regards, Bodo