In x, y, z binning plot, if we do not put any value in x, y , z projection limit and if we select z, then the plot will be xy projection plot, right ? Then what are the associated z values for them ?
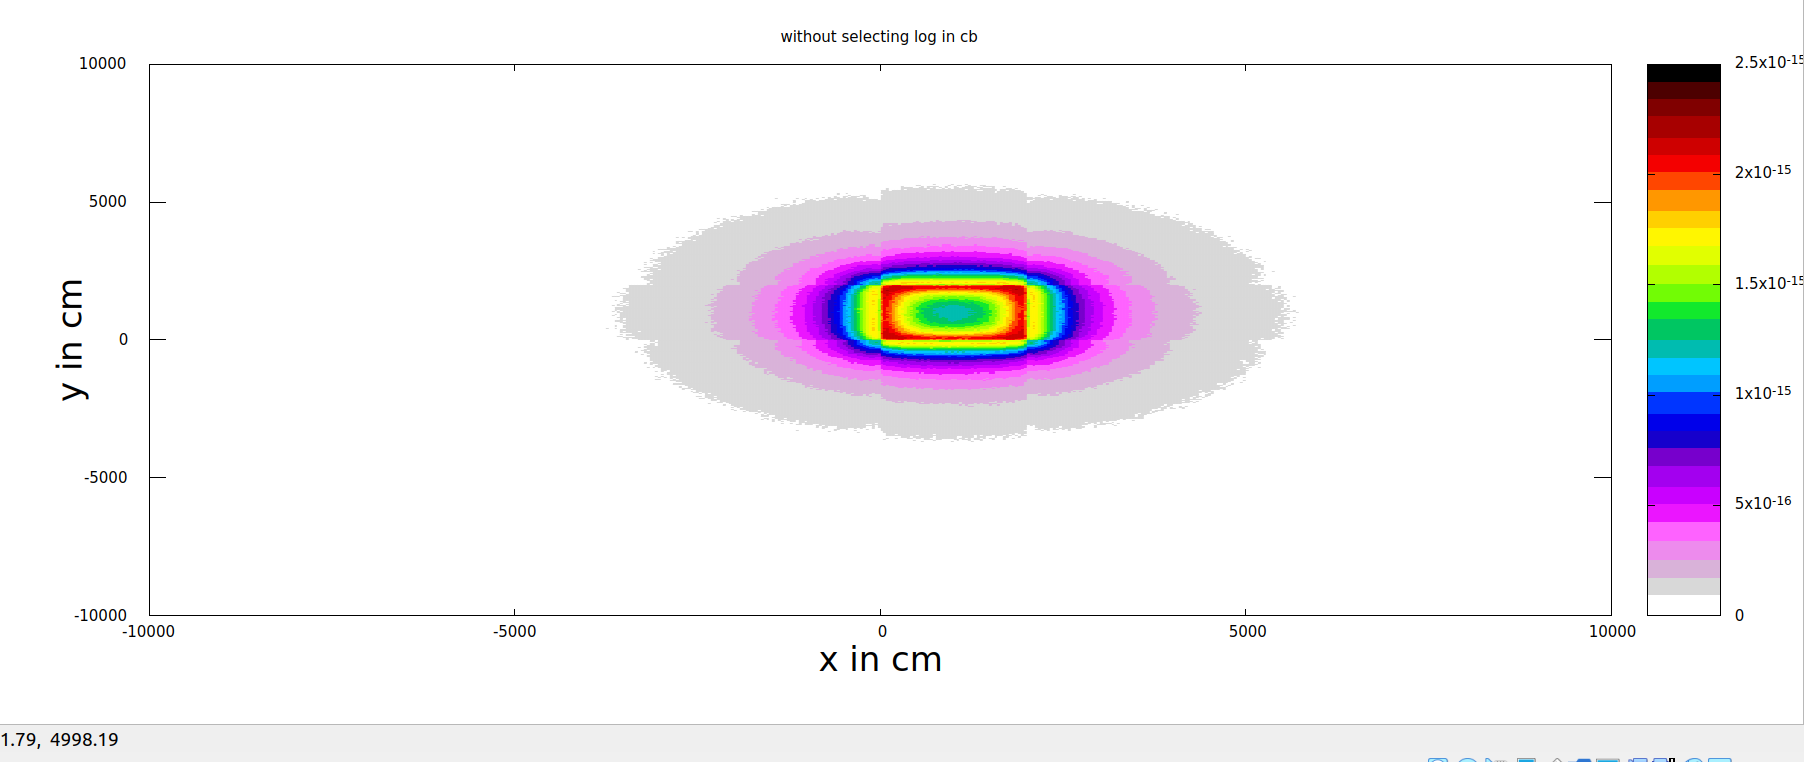
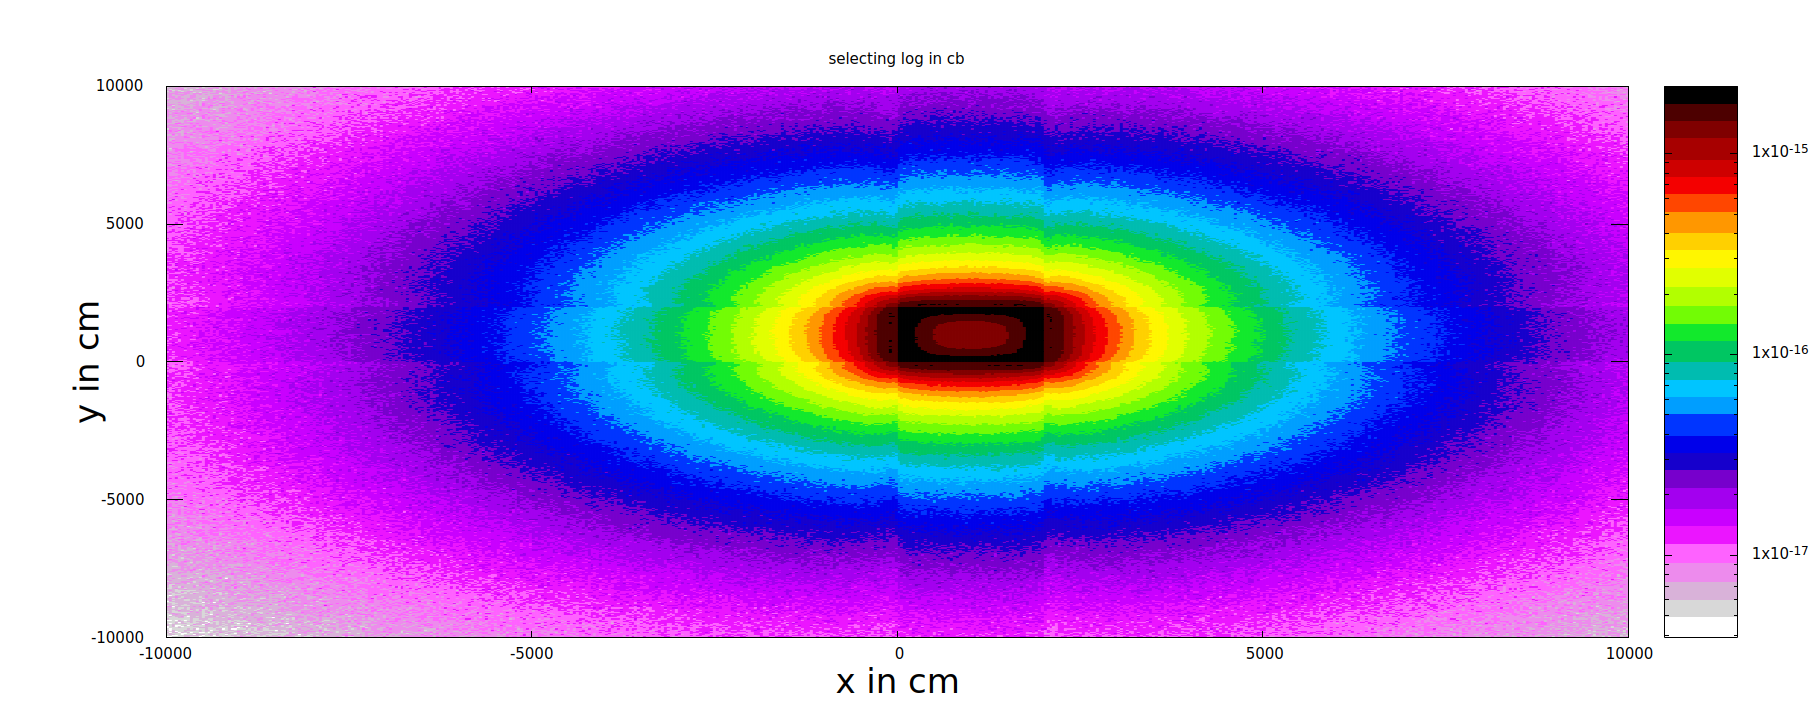
If we tick log in cb, then are the urbin outputs in log scale ? By turning it on and off, these type of plots are obtained. Can you please explain what’s the reason behind this? When cb is not set in log scale, the color profile is vanishing after a certain distance.
In the above plotting, the range of x axis and y axis are same, but the scaling is not same in both the axis, leading to an oval shape ( I feel it will be circular if the scaling is same in both the axis). Can you please guide how to set that ?
After plotting, by moving the cursor, we can see the coordinates of x and y axis at that location, but can we see from the plot what the value of the usrbin at that location is ?
Can we resize the plot, for example the x and y are in cm, but if we want to plot the graph in m unit without disturbing the usrbin output value, can we do that here ?
Sorry for these long quires. It will be very helpful if you can guide me.
To better understand the problem you are facing, could you please attach your input file and the FLAIR project?
Regarding the other questions:
If you are interested in 2D projections then what you get if the 2D distribution in X and Y averaging the values over the whole Z-range, since no limit was selected. However, if you select 1D projection you get the average over the whole X and Y ranges along the Z coordinate.
Setting the cb into log or linear scale affects the way you visualize the values from your scoring but the values of each plotted bin are the same. Turning it on or off does not affect the output value. In some problems is more appropriate to use the log-scale since the scoring values are distributed in a wide range while linear is more convenient when the range does is much smaller. That explains the change in the color.
To set the right proportion between the axes go to the “Plot” tab in FLAIR, then click on “Title”. You will see a number of new options just below. Press “Auto”. You will see that a number will appear in “aspect”. Since both ranges are the same, it will be set to “1”. Then, you plot it again and the proportion should be the one you expect.
The contain of the bin is the cb-axis (the color bar on the right).
There is a way but requires the use of the text box below the plot options. Basically, what you have to do is to re-write the same command line for plotting your usrbin modifying the axis scale. An example: splot ‘dummy.dat’ us 2:1:3 notitle
you can replace it by: splot ‘dummy.dat’ us ($2/100.0):($1/100.0):3 notitle
Note: In order to get the first command, click on the console bottom, the black one on the bottom-right corner of the Plot tab, after plotting your usrbin. The last line corresponds to the plotting command.
the errors you see are very likely related to the virtual machine you are using. It is not possible to create symbolic links in a folder shared with Windows.
Please try to copy your files to a directory under /home/<username>/.
Thank you @msabateg and @horvathd, it was very helpful.
I have few more doubts. It will be very helpful if you can clarify.
If we want to increase the spacing between the label and the axis line in vertical and horizontal axes or in case of title or the cb label, how can we do that? We have to write some command in the options bar, right? Is there any document of the necessary commands for further study?
When we select x, y or z in projection plot, how the vertical and horizontal axes are decided? Do they follow right hand rule ? Like if we select z then vertical will be x and horizontal y ? similarly, if we select y, then vertical will be z and horizontal will be x ??
To include an offset in the label location you can insert the following Gnuplot command in the text box of the Plot tab: set xlabel offset offset1,offset2
Being offset1 and offset2 the values you want to include. Equivalently for the title offset and the other axes.
You can find these kind of commands on Gnuplot manuals or forums.
The default projections are:
In Z: X-axis horizontal and Y-axis vertical.
In Y: Z-axis horizontal and X-axis vertical.
In X: Z-axis horizontal and Y-axis vertical.
Nevertheless, on the right side of the “Projection & Limits” box there is the option to “swap” the default configuration.