Dear FLUKA community,
I would like to ask for your advice regarding an issue I encountered.
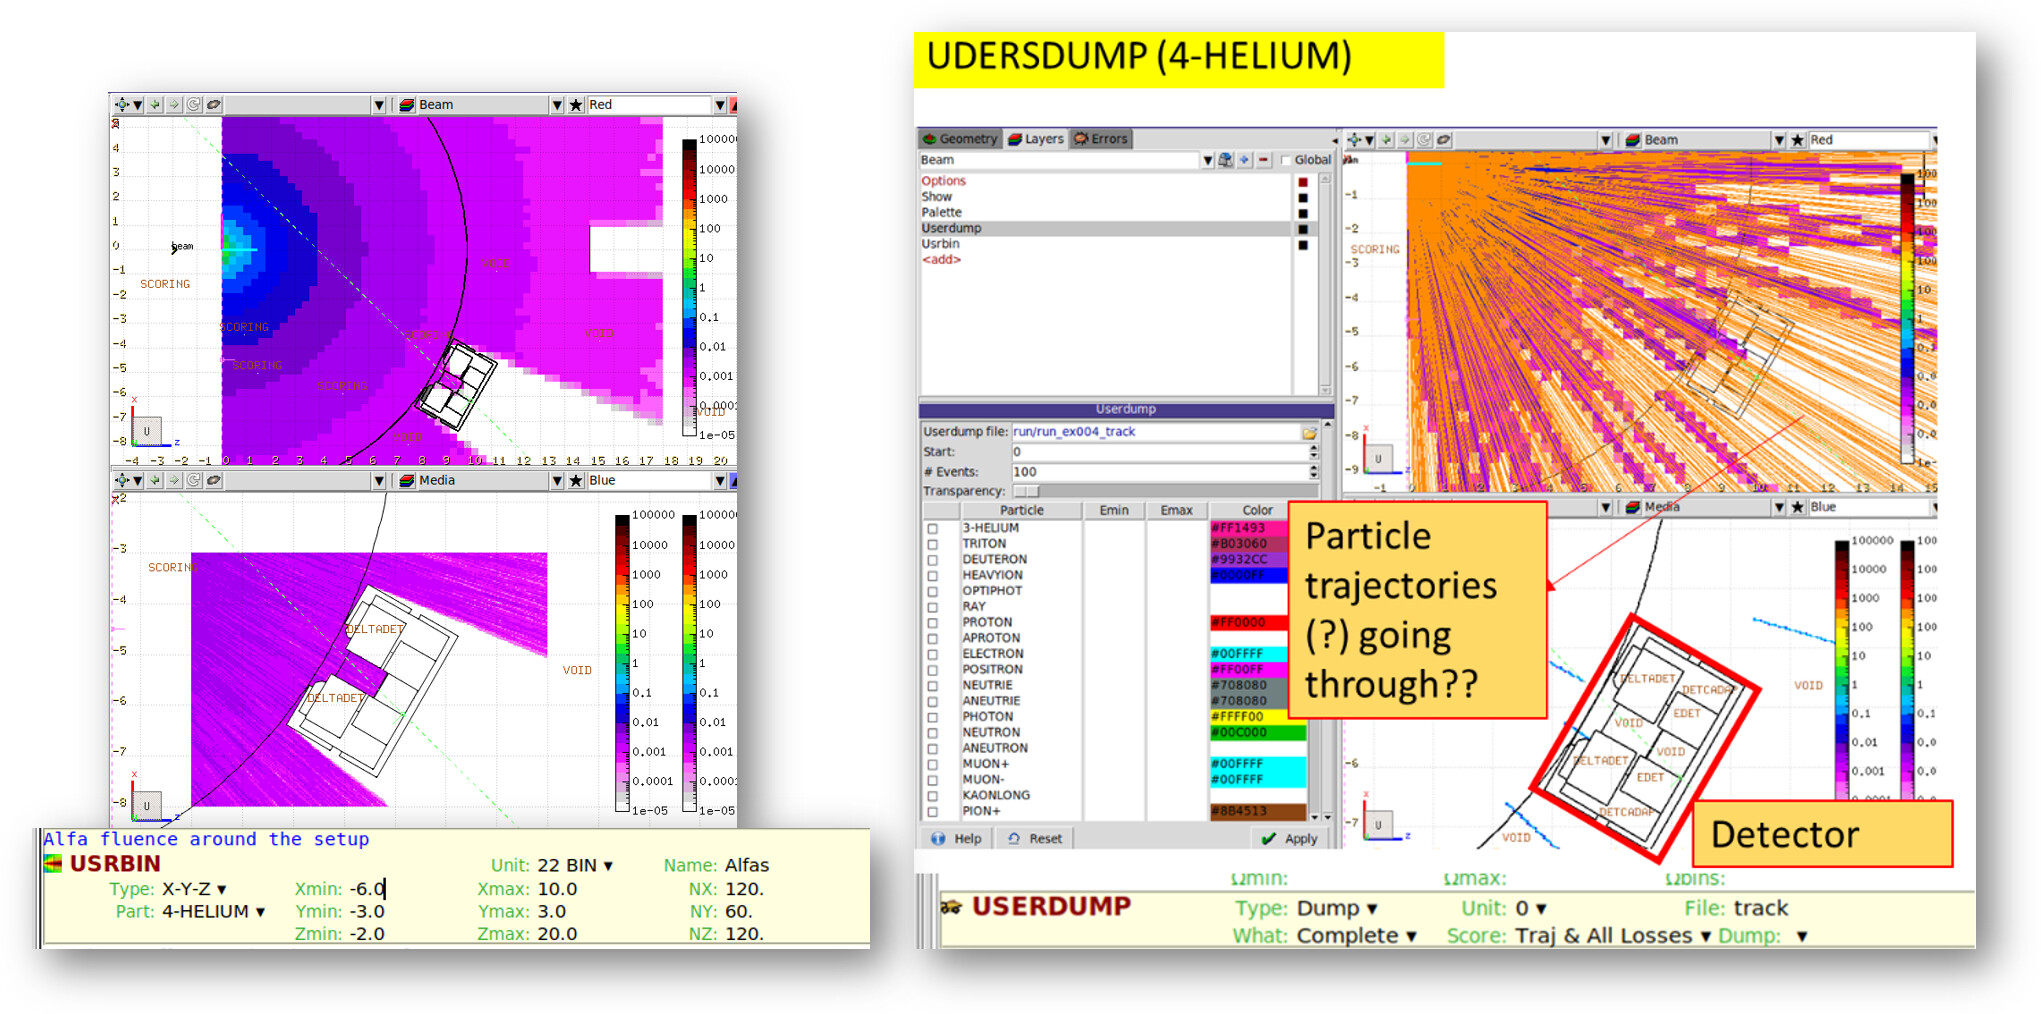
I am running a simple simulation where I define a source routine emitting low-energy alpha particles, with the aim of having them enter a detector volume.
I am using a USRBIN to score, and the resulting plot clearly shows that all particles stop inside the detector, as expected.
In addition, I have included a USERDUMP, as I would like to visualize the particle trajectories. However, the USERDUMP visualization is not behaving as I anticipated:
- In the
USRBIN, the particles are seen to stop inside the detector. - In the
USERDUMP, the trajectories appear as straight lines, passing through the detector without showing any interaction or stopping.
I am wondering whether I might be misunderstanding how the USERDUMP should be interpreted, or whether this behavior indicates some issue with my setup.
If anyone has encountered a similar situation or can provide some insight, I would greatly appreciate it.
Thank you in advance.