Dear FLUKA community,
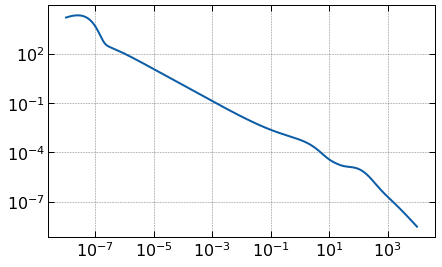
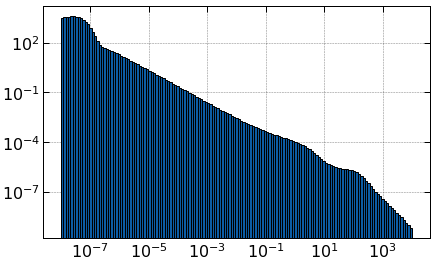
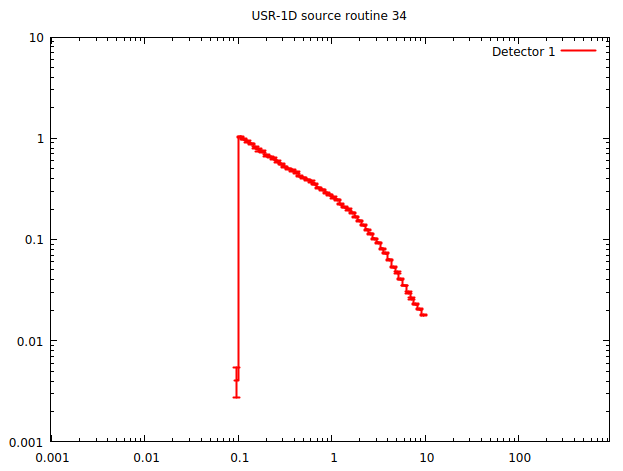
I’m looking for a way to validate a neutron energy spectrum as an input to run simulations. I previously have posted this thread at the fluka forum (Defining a volumetric neutron source with energy sampled from a histogram) and I’m grateful for all the responses. But I’m not confident if I’m setting the right initial conditions with the spectrum input data and the current results I’m obtaining. First, I’m using a wide neutron spectrum which spans 12 decades of energy. The analytical function and the histogram generated with a python code are shown below, the x axis is energy in units of MeV and y axis is neutron flux in arbitrary units. Using the tutorial provided within the examples of sourcing and scoring (https://indico.cern.ch/event/1123370/contributions/4716065/attachments/2447426/4193836/ex_source_routine_2022_ULB.pdf), I want to validate my input by reproducing the same plots using the USRBDX scoring cards. The provided FLUKA-FLAIR input is just a vacuum with different regions to analyze the spectrum at the interface between regions. Unfortunately, I’m struggling to interpret the results I’m obtaining. The first problem is the scoring is not recognizing the neutrons with lower energy. The second is that the obtained plots are not similar with the inputed spectrum.
Sincerely,
Matheus Bergamo
m235650@dac.unicamp.br
Gleb Wataghin Insitute of Physics
Campinas State University
Brazil
source_routine.flair (2.4 KB)
source_routine.inp (1.6 KB)
spec.dat (5.7 KB)